How meaningful are clicker data?
Contributors: Meike Akveld (D-MATH), Menny Aka (D-MATH), Alexander Caspar (D-MATH), Marinka Valkering-Sijsling (LET), Gerd Kortemeyer (LET)
Among other things, ETH Zurich’s EduApp allows instructors to pose clicker questions during lectures. Instructors can interrupt lectures to ask questions from the students and get and give feedback on learning progress. Lecturers can also trigger phases of peer-instruction, where students discuss their initial answers to a question with one another and then reanswer the question – in effect, the students are teaching each other during those phases, thus „peer instruction“. By asking students to answer a question twice, lecturers gather data on student understanding. But how meaningful is this feedback data, in particular, when answering is voluntary and ungraded?
A group of mathematics instructors at ETH’s D-MATH worked with LET to analyze EduApp data using Item Response Theory (IRT), Classical Test Theory (CTT) and clustering methods. Over the course of the semester, 44 clicker problems were posed – 12 of them twice, as the instructor decided to insert a phase of peer-instruction. The following figure shows an example of the kind of problem being analyzed:
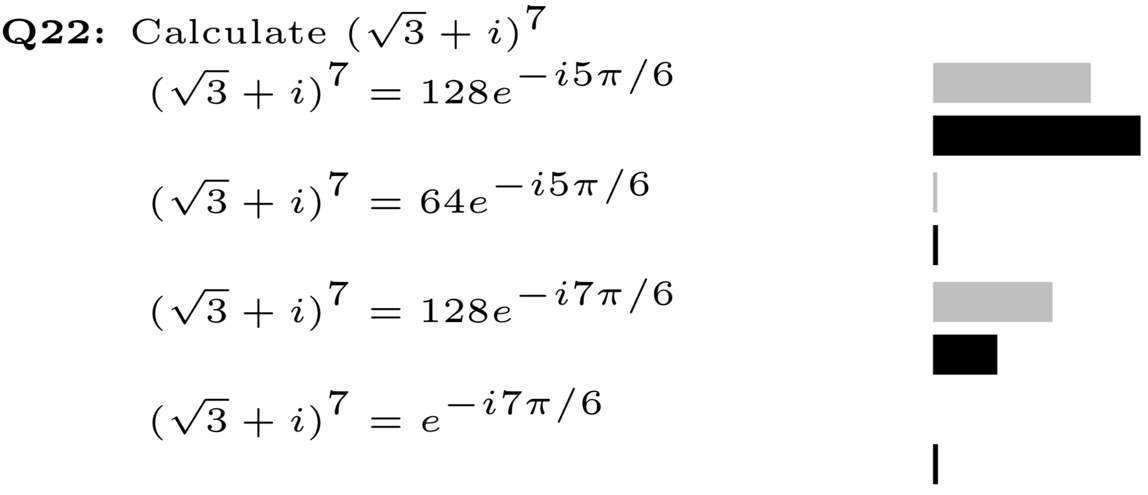
The problem shown was used in conjunction with peer-instruction; the gray bars indicate the initial student responses, the black bars those after the discussion. A simple, unsurprising observation is that after peer-instruction, more students arrived at the correct answer. What can we learn from these responses? CTT and IRT can provide psychometrics that help understand this instructional scenario.
When it comes to being „meaningful,“ the „discrimination“ parameter of a problem is of particular interest: how well does correctly or incorrectly answering a problem distinguish („discriminate“) between students who have or have not understood the underlying concepts?
CTT simply uses the total score as a measure of „ability“, but also has a measure of discrimination („biserial coefficient“). IRT estimates the probability of a student arriving at the correct answer for a particular problem („item“) based on a hidden („latent“) trait of the student called „ability“ – typically, higher-ability students would have a higher chance of getting a problem correct. How exactly this probability increases depends on problem characteristics („item parameters“).
In IRT, the ability-trait is determined in a multistep, multidimensional optimization process, where the difficulty and discrimination parameters of particular problems („items“) feed back on how much correctly answering that problem says about the „ability“ of the student; „high-ability“ students are likely to get correct answers even on high-difficulty, high-discrimination problems.
The results of their study were extremely encouraging: using both CTT and IRT, almost all 44 problems under investigation exhibited strong positive discrimination in the initial vote. This means that the better the student understood the underlying concepts, the much more likely they were to give the right answers – and vice versa. A low discrimination, on the other hand, means a problem provides less meaningful feedback. For the handful of problems which had lower (yet still meaningful!) discrimination, this could be explained by other problem characteristics, for example, that at the time they were posed, they were still too hard or already too easy – but even that feedback is meaningful to the instructor for future semesters.
The truly surprising result of the study was that in all cases of peer-instruction, the problem had even stronger discrimination afterwards! Yes, unsurprisingly more students answer correctly after discussion with their neighbors (the problem becomes „easier“), but: peer-instruction does not simply allow weaker students to enter the correct answer, it apparently helps them to perform at their true potential.
For the purposes of the study, the clicker data had to be exported manually, but the next version of EduApp, slated to be released in December 2020, will allow export of data for learning analytics purposes directly from the interface – the following figure shows a sneak preview of that new functionality.
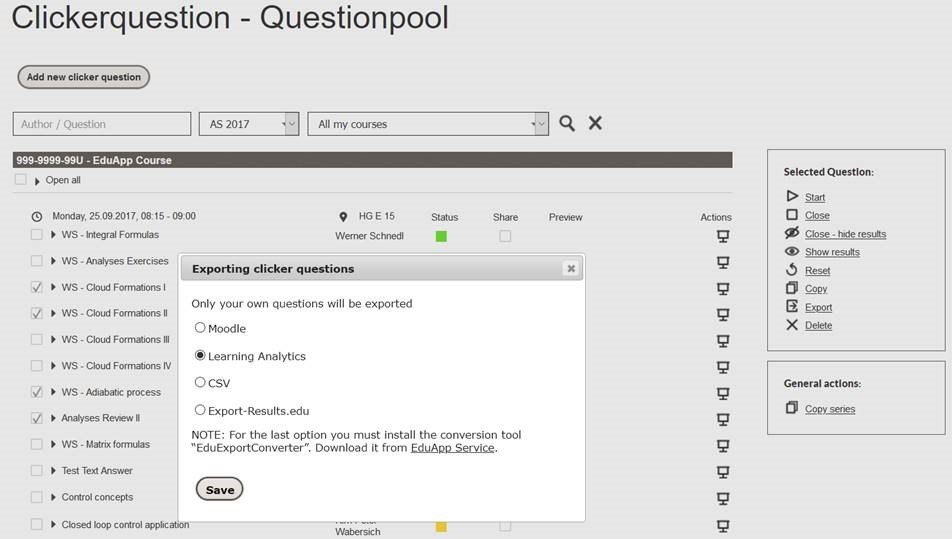
The exported data format is compatible with input for the statistics software R, and there are variety of guides available for how to analyze this data (https://aapt.scitation.org/doi/abs/10.1119/1.5135788 (accessible through the ETH Library) provides a „quick-and-dirty“ guide).
The full study, including results from Classical Test Theory and clustering methods, as well an outlook for new EduApp-functionality is available open-access in Issue 13 of e-learning and education (eleed) under https://eleed.campussource.de/archive/13/5122.