Calling Bullshit: The Art of Skepticism in a Data-Driven World

book

by Carl Bergstrom and Jevin West

Random House, New York (2020), 318 pages

https://www.callingbullshit.org

“Bullshit involves language, statistical figures, data graphics, and other forms of presentation intended to persuade by impressing and overwhelming a reader or listener, with a blatant disregard for truth and logical coherence.”

For most of the book, the authors dig into how scientific results can be compromised at different levels (publications, press releases, social networks). They point at well-known fallacies in statistics and visualizations by providing some surprising examples (many from biology) that they have debunked and well documented by themselves.

In chapter 9, and this was for me the most important part, the authors discuss the primary aims of scientific research, its threats, and why scientific reasoning and scientific methodology still helps us understanding the world better. Especially in the context of the actual discussion on distrust in science (related to the pandemics) this chapter becomes even more relevant.

In their final two chapters the authors provide some general hints on how to identify and on how to refute (call) bullshit. They stress that refuting false claims should be done in a humble, respectful but nonetheless stringent way. Calling bullshit is not a matter of impressing your audience, but it is a moral imperative and at the end it makes ourselves as researchers “more vigilant , a little more thoughtful, a little more careful when sharing information.” (last sentence of the book).

Unfortunately, the book was written in pre-covid19 times. The bulk of actual misinformation and scientific misinterpretation, however, gets easily seizable with the help of this book.

The book is based on a course from the University of Washington, that the authors now have been teaching for some time. Elements from this course and transferred to other subjects suits well for all of our ETH courses and they will empower our students to think more critically on their role as a future researcher and societal policymaker.

I really enjoyed reading this book, written in a funny and personal style, and I can highly recommend it to anyone who is teaching science.

One week of Corona online teaching: experiences and outlooks

The decreed transition from classroom to online teaching caught us off guard at the Department of Physics, as anywhere else. Within a few days, almost 25 central lectures together with five laboratory courses, covering over 3,500 students, had to be switched to online mode. It is due to the high engagement and cooperative commitment of all members from the department that this enormous challenge could be mastered without any transition. None of the courses had to be canceled and since last Monday, all teachers, lecturers as well as teaching assistants, are teaching online.

D-PHYS goes online

Now, after one week of online teaching, it is possible to review the impacts of this switch. In addition, a look into the near and even into the far future should be allowed. How will teaching develop in the coming weeks? What lasting impact will the online shift have on higher education?

In the first days following the shift, the focus was mainly linked to technical problems: What tools should I use to teach online? Here we benefited from the fact that ETH relied on the Zoom platform right from the start. Although other options for teaching, such as recording self-made videos or using Moodle were also recommended, we mainly advertised Zoom at our department and offered an appropriate support. With Zoom, all lectures can be streamed live and students can even ask questions during the event. For courses relying on blackboard writing and experiments, we have set up a special installation in our main lecture halls where lecturers can stream their lecture via Zoom (without students in the hall). Lecturers who do not rely on the large blackboards and on the experiments give their lectures from home by using Zoom as well.

streamed lecture
Live lecture streamed with Zoom from the lecture hall with 141 students in the virtual audience.

With the setting offered by Zoom, it was possible to transfer the concept of the traditional classroom lecture more or less smoothly to online teaching. This was particularly important in the initial phase because the lecturers did not have to redesign their courses. The shift to technical new ground was already demanding enough.

Now, with the lecturers gaining more confidence in using Zoom, didactic reflections are emerging.

Does it really make sense to teach online the same way I have done it before?
Should I try to redesign my course in a more appropriate way for online teaching?

Scenarios such as flipped classroom, question and answer sessions or small project assignments are coming on the agenda. After the technical shift, we now experience a merging didactic shift. Of course, technology still plays an important role, but the focus lies on didactic implications. Lectures profit from their research experience in using communication and cooperation tools. Now they start to transfer those or similar tools to teaching and learning.

At least, the didactic phase is no longer under imminent time pressure. Lecturers have time to plan and to think about creative didactic experiments. Thus, in the near future supporting lecturers in new didactic implementation will become paramount, be it through didactic expertise or by disseminating tested scenarios.

It may seem premature at this point to look at the post Corona period. However, it is already clearly noticeable that traditional teaching is moving to new grounds. An increased number of online courses will continue to be part in higher education when we switch back to face-to-face instruction. Lecturers are now gaining insight in new didactic settings that they will be able to transfer to regular classes. Even brand new ideas might pop up and at the end, students will profit from an increased portfolio of many different teaching and learning opportunities.

With the next exam period ahead in May, the problem of assessments still remains unresolved. Even if oral exams offer a short-term alternative in a few cases, we still have to think about further online alternatives. The next coming months will keep us busy, anyway …

RTOP – ein Bewertungsraster für gute Lehre

Lecture

Wie bewertet man eine Lehrveranstaltung im Rahmen von einer Hospitation? Von der Hochschuldidaktik werden dazu unterschiedliche Instrumente zur Verfügung gestellt, die meist auf eigenen Erfahrungen beruhen, oder auf spezielle Aspekte des Unterrichts ausgerichtet sind.

An der vergangenen AAPT Konferenz hatte ich die Möglichkeit, im Rahmen eines Workshops, RTOP (Reformed Teaching Observation Protocol) auszuprobieren. RTOP wurde in den späten 1990er Jahren an der Arizona State University entwickelt, um Lehrveranstaltungen aus den MINT-Fächern nach den Standards des studierendenzentrierten Unterrichtens zu evaluieren. Es handelt sich um einen Fragebogen mit insgesamt 25 Items, die jeweils auf einer fünfstufigen Likert-Skala («nicht vorhanden» bis «sehr anschaulich») zu beantworten sind. Die Items sind dabei in drei Hauptkategorien aufgeteilt:

  1. Planung und Umsetzung (lesson design and implementation)
  2. Inhalt (content)
  3. Gegenseitiger Umgang (classroom climate)

Typische Items aus RTOP lauten:

The instructional strategies and activities respected students’ prior knowledge and the preconceptions inherent therein.

Connections with other content disciplines and/or real world phenomena were explored and valued.

There was a climate of respect for what others had to say.

Der gesamte Fragebogen (in Englisch) kann hier eingesehen werden:
http://physicsed.buffalostate.edu/AZTEC/rtop/RTOP_full/PDF/RTOPform_IN001.pdf

Üblicherweise protokolliert der Hospitant seine Beobachtungen während der Lehrveranstaltung und füllt den Fragebogen nachträglich aus. Um einheitliche, vergleichbare und zuverlässige Ergebnisse zu ermöglichen, stehen diverse Anleitungen und Videos mit Trainingsbeispielen zur Verfügung.

Das Instrument basiert auf Ergebnissen der Lehr- und Lernforschung, es ist validiert und kann sogar für Forschungszwecke verwendet werden. In einer grossangelegten Studie benutzen Granger et al. (2012) RTOP zur Bewertung der Lehre und konnten damit die erhöhte Lernwirksamkeit von studierendenzentriertem Unterricht nachweisen.

Bei einer Hospitation lässt sich das Instrument jedoch auch, ohne grossen Trainingsaufwand, als Diskussionsbasis im Rahmen einer Nachbesprechung mit den Dozierenden verwenden. Nächste Woche beginnt das Frühlingssemester und ich werde RTOP bei meinen Hospitationen auf jeden Fall ausprobieren. Zu den konkreten Erfahrungen mit RTOP berichte ich dann gerne hier im Blog.

Alle Infos und Materialien zu RTOP finden sich hier:
http://physicsed.buffalostate.edu/AZTEC/RTOP/RTOP_full/index.htm

Eine deutsche Übersetzung liegt vor und kann bei der Projektverantwortlichen Kathleen Falconer (http://www.physikdidaktik.uni-koeln.de/falconer.html) beantragt werden.

Master Thesis Evaluation – a Web Tool

The problem

Grades do not tell anything precise about the student’s abilities in the areas of scientific work, project management, critical thinking and social skills. And, in Switzerland especially, they do not offer any meaning to non-Swiss.

The solution

Additionally to the grade, we offer a report that describes the student’s abilities thoroughly. Since report writing is arduous, we developed a web tool MTE (Master Thesis Evaluation) that will calculate the grade and produce a report in a few clicks. You can still individualize the report afterwards, deleting and adding parts.

Further Advantages

  • Compliance: Grade calculation and partition follow the study guidelines.
  • Fairness: The professors all assess along the same criteria.
  • Service to the student’s future: The report can be part of the student’s portfolio.

Info

More info on MTE can be found in the moodle course “Master Thesis Evaluation“.

Here is an fictive report:

Virtual Labs @ETHZ, so far

Implementing Virtual Laboratories in HigherEd

It has been more than three years since I started implementing virtual labs (chemistry and biology labs) at ETH Zürich. I put together the experience so far in a PolyBook (used to be on eSkript: https://eskript.ethz.ch/labster/. Enjoy reading about what has been, and get the feeling of what the future holds! It includes an evaluation and small experimental study.

Flipping large university courses: medium-term effects of active learning

Introduction

In a flipped learning setting, the major part of content delivery is accomplished outside of the classroom and class time is instead used for engaging students in collaborative and hands-on activities. During the past decades, this pedagogical approach has gained much popularity and a large body of research supports its benefits. Implementing flipped learning, however, is not obvious and relies on many factors related to the local learning and teaching culture, the existing assessment regulations, the curricular boundary conditions and, most important, on scalability considerations. Flipping a class with 30 students might be considered as a feasible task, but flipping a lecture with 300 students turns out to be rather challenging and may potentially require considerable investments, such as room reconfiguration and increased teaching manpower. Before any department or university considers adopting flipped learning in a given local context, it will be necessary to identify possible assets and drawbacks beforehand. For this reason, we have conducted a pilot study within a physics lecture class of 370 students at a major Swiss research university.

Setting

During the spring semester 2017, we have divided a non-physics undergraduate student cohort into two parallel teaching settings, one focusing on skill development (SCALE-UP) and one focusing on content delivery (LECTURE).

In the SCALE-UP setting, students had to prepare the content prior to coming to class (flipped classroom).

Photos of the lecture hall and of the SCALE-UP classroom

Photos of the lecture hall and of the SCALE-UP classroom

In order to conduct a comparative study of the two different pedagogical settings, we recorded the performance of the complete student cohort (both SCALE-UP and LECTURE) at two different points:

  • Physics mid-term exam: 10th week during the intervention
  • Physics final exam: 8 months after the intervention

The physics mid-term and final exams included conceptual and numerical questions. In the mid-term exam, 50% of the points could be achieved by conceptual multiple-choice questions, whereas the ratio in the final exam was 40%. Therefore, we were able to split the overall achievement into conceptual and numerical performance components. Conceptual questions assess student understanding of the underlying phenomena rather than the application of the physics material within a mathematical framework. Thus, our study enables us to make a clear distinction between the conceptual understanding and its numerical transfer.

Furthermore, the physics final exam was split into one part (Phys1) covering the topics  that were introduced during the flipped classroom intervention in spring and another part (Phys2) with the topics that were covered in autumn without a parallel setting. With this distinction, we are able to draw conclusions on longitudinal effects (Phys1) and on how well the learning achievements of the flipped class can be transferred to new topics (Phys2).

Throughout the performance analysis, we are only considering students who took part in all assessments. As a result, we had to reduce the overall population to 35 students in the SCALE-UP setting and 133 students in the LECTURE setting. The data are still sufficient to run statistical tests, even though we have to deal with an unbalanced design.

Performance Results

Performance gains of the SCALE-UP students

Performance gains of the SCALE-UP students: In order to compare the performance of students from the SCALE-UP setting to those of the LECTURE, we have conducted a series of independent t-tests. The gain is calculated by the difference in the means G = M(SCALE-UP) – M(LECTURE).
Error bars correspond to the 95% confidence intervals. Effect sizes of d=0.2 are considered to be small, whereas d=0.5 is related to a medium effect and d=0.8 to a large effect.

Medium-term performance effects

Medium-term performance effects: We can directly compare the performance recorded in the mid-term exam to the performance in Phys1 by running a series of dependent t-tests. The mean difference is calculated by M(PHYS1) –M(Midterm).
Error bars correspond to the 95% confidence intervals. Effect sizes of d=0.2 are considered to be small, whereas d=0.5 is related to a medium effect and d=0.8 to a large effect.

  • During the intervention period, students from the flipped SCALE-UP group outperformed students from the LECTURE setting. This performance gain, however, was substantially reduced when evaluated over the medium-term scale.
  • For those students who participated in the 14-week flipped SCALE-UP group, we could not identify any transfer or modification of learning behavior that would induce better performance outside of a dedicated flipped learning setting.

Conclusions

  • A single active learning intervention of one semester (14 weeks) is too short to sustain substantial performance gains.
  • Even though students enjoyed the flipped class very much, their performance gains were much lower than those reported from the (mainly U.S.) literature.
  • Curricular constraints such as contact hours and assessment conditions should be considered and adapted when shifting to a flipped class setting.

The full paper, including further results, presented at EDULEARN18 is available from >here<.

Teaching Scenarios: Interactive Lecture Material & Collaboration

eSkript, the platform for interactive lecture material at ETH Zurich was born in 2014 (cf. the interactive timeline about eSkript; new PolyBook link), and since then many scenarios have been used by many lecturers. (eSkript is available to all Switch AAI affiliated persons.)

The main goal of interactive lecture material is to engage students, which promises better learning outcomes. As a byproduct, it makes lecturers happier and have fun! 🙂 The following selection of scenarios have been used at least a few times each. Bear in mind, there are many more possibilities.

1 – Review

Students are the best judges of your material. Make it available for annotation and let students correct it and give you feedback. Already after one round, your material will be perfect!

2 – Collaborative Study Material

Many students or many groups of students create material together. Students experience collaboration and see its benefits. They have access to other students’ work and because the material is presented as a whole, the result is something they can be proud of. Furthermore, peer review and annotation by peers or assistants is then possible.

3 – Feedback

When students publish work (text, papers, exercise solutions, etc.), assistants and lecturers can easily give feedback and start discussions on very good points students came up with or problems they seem to have, on the spot.

4 – Working with Texts (Papers, Journals, Articles,…)

Students can answer predefined questions (by lecturers/assistants/peers), ask questions about difficult passages, paraphrase, discuss interesting points, attach complementary material, prove points with links to other research, reflect and form opinions right where it is relevant. This kind of assignments foster critical thinking and collaboration. It is much easier and more appealing than using a forum, which is the alternative for such tasks.

5 – Voting

Easily get feedback (students can append a star to parts of content of your choosing) on good/important/… content. You can even go further and let students collaboratively decide through their voting on…[depending on your scenario].

6 – Interactivity Modules

By far my favorite application in eSkript are the interactive modules. The possibilities are endless. You can enhance your material with interactive videos, drag and drops, timelines, interactive images (juxtapositions, sliders, info hotspots, hidden hotspots, and sequences), and many more. A scenario that has worked repeatedly well is the design of interactive modules by students. Check out a few examples of interactive modules (new PolyBook link)!

These and more scenarios in more details with detailed tasks, profit, caveat and real life cases can be found in the eSkript Scenarios (new PolyBook link).

Have fun and find new ways to engage and interact with your students! Open your first eSkript (new PolyBook link) today.

Open Your own eSkript

Note from May 2019: eSkript is not maintained anymore but PolyBooks are taking over! Contact LET for support.

The World Climate Simulation

Teaching anyone properly about Climate Change is a difficult task. The concept is simple to grasp: “if the global temperature rises above 2°C in 2100 – that’s bad!” But understanding the sophisticated climate models that scientists develop and translating this understanding into political negotiations, that’s a tough challenge. The World Climate Simulation, made available by the MIT think tank spin-off Climate Interactive, and facilitated by Prof. Dr. Florian Kapmeier (ESB Business School, Reutlingen University) for MTEC faculty and students on March 19th 2018, did just that. Here are some personal reflections.[1]

Source: Getting to 2°. Emotions (and temperatures) run high in a mock climate negotiation. by Robin Kazmier, SM ’17, MIT Technology Review, August 16, 2017

The scenario is as follows: at the next United Nations Climate Change Conference, the UN Secretary General (enacted by the simulation’s facilitator) asks the participating countries and country blocs to make pledges to curb the negative effects of climate change. USA and Europe get seats at lushly decorated conference tables, stocked with privileges and amenities: coffee machines, food, fruits, and soft drinks. Other developed countries like Russia, Canada etc. find themselves at sparsely equipped conference furniture, but they still get a few sandwiches. China and India both get nothing but some water on their tables, while the large bloc of developing countries face a blunt reality: no food, no water, no chairs, no table. The unequal distribution of wealth across the nations becomes clearly visible at the beginning of the game.

At the sidelines and without voting powers, fossil fuel lobbyists, climate activists, and a delegation of US cities and states, the US Climate Alliance, complete the line-up. The simulation can easily accommodate 60 participants; we played it with 20 and without the fossil fuel activists.

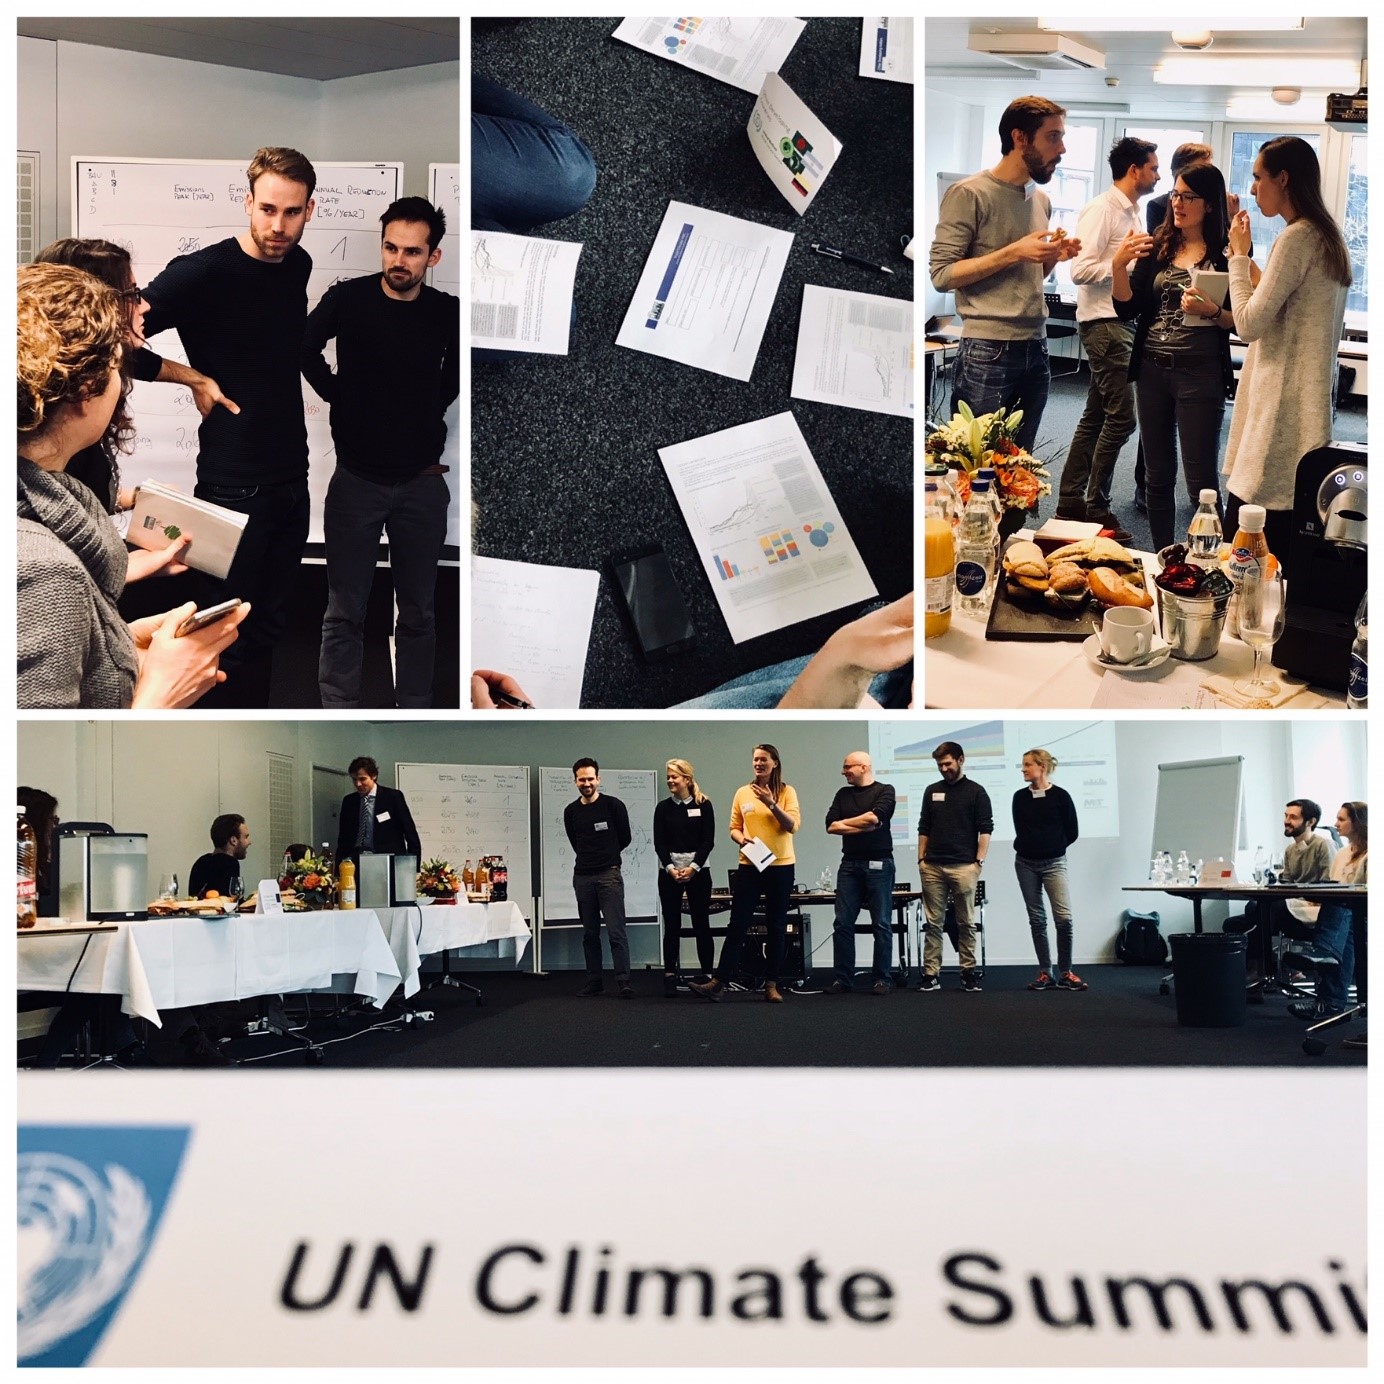
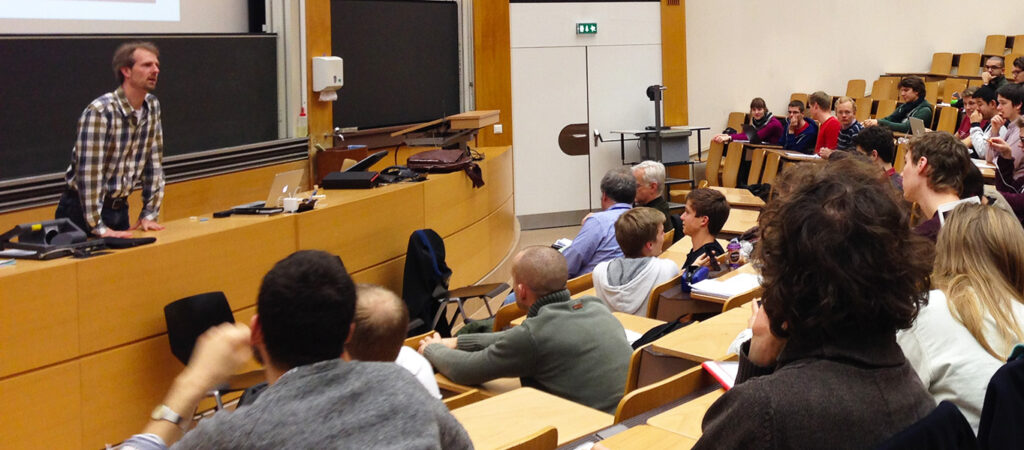
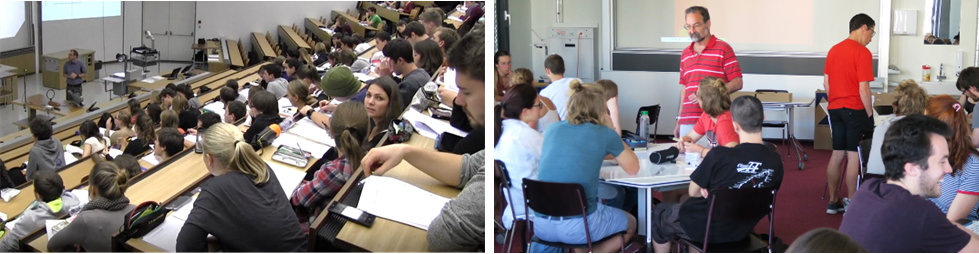
Figure 1  Impressions from the WCS negotiations

Equipped with brief profile information for the participants that summarize their respective positions in the climate negotiations, a first round of negotiations starts. The countries give a two-minute statement in the UN assembly. Their pledge contains concrete numbers: the year their emissions peaks, the year the reduction of emissions begins, the rate of yearly reduction, and percentage numbers for the prevention of deforestation and afforestation efforts. And then, money talks: how much will the regions contribute to the global fund for mitigation and adaptation to climate change in billions USD per year? These variables from all six countries and country blocs are put on a flipchart.

The US delegation opted for realpolitik in the spirit of pulling out of the Paris climate agreement. Climate change is fake news, hence: no contributions. The EU delegation pledged their green agenda, but tied their contributions to the fund with deal breakers: China, India, and the developing nations have to aim for ambitious goals to curb climate change. Which they didn’t. China argued that the causes for the current situation are rooted in the American and European centuries of industrialization; therefore, it is a European and American responsibility to fix the mess. Likewise, India’s delegation saw prospects of their nation’s industrial development. The developing nations sought to catch up economically and would need to produce enough food for their population. Actually seeing the abundance of food in the “first world” and growing increasingly hungry (having skipped lunch) did not lead to appeasement. The Climate Alliance’s meagre donation of grapes rather accentuated their grievances.

A political solution to the climate change negotiations seemed far away. Having given their pledges, participants voted on the expected result for global warming in 2100. Would it be business as usual with its foreseeable catastrophic events of more than 4°C rise in global temperatures? Or would the pledges lead to outcomes around 3.6°C or even approach the ambitious aim of 2°C global warming in 2100?

Pessimism flooded the room as the numbers were punched into C-ROADS. C-ROADS (Climate Rapid Overview and Decision Support) is a scientifically-reviewed policy simulator on climate change, with which users can test their own emission pathways to limit global warming to below 2°C and thus learn for themselves. The results are calculated in real-time and give a direct visual output on the effects on global warming (temperature), ocean acidification, and sea-level-rise. A screenshot is given in figure 2.

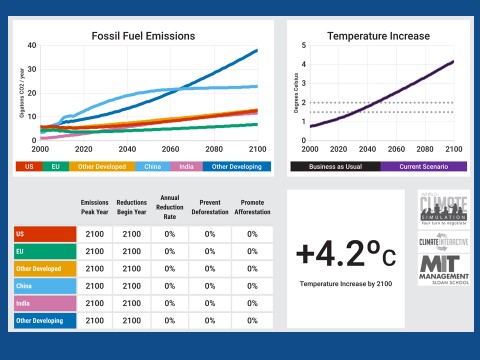
Figure 2 – Screenshot of the C-ROADS simulator

Result of the first round of negotiations: somewhere around 3.6°C rise in temperature. The UN Secretary General took the outcome to give a passionate input to the conference participants of what this would mean in reality: flooded coastal regions all over the world, with an uninhabitable Shanghai, and foreseeable catastrophic weather conditions with ever stronger and more frequent tropic storms.

The second round of negotiations began with Trump walking out and going golfing. India claimed USA’s coffee machine, and the developing nations began looting. They stripped the US delegation of their sandwiches, cookies, and soft drinks, and also took the conference chairs. They left the flowers. The EU, Russia and Canada negotiated as if there is no tomorrow, and China’s delegation opened up to the idea that actually having a tomorrow that is worth waking up to was not too bad after all. The second round of pledges was typed into C-ROADS, and while the result improved upon the first round, it was still far away from the 2°C goal. A sobering outcome.

The ensuing discussion lead to a much deeper understanding of the different factors and their effects on the climate change projections. It is difficult to describe the increased comprehension of the participants for the numbers and the data in the complex climate models. But the questions and attempts to solve the climate dilemma made it clear that the World Climate Simulation succeeds in engaging participants with a truly mindboggling dataset. It accentuates the interdependencies of the different countries and the need to collaborate to reach solutions. In a more striking way, the potential health benefits for people that will accompany a transition away from fossil fuels to renewable energy sources surprised me. To pick just one example: less fossil fuel use means less asthma; treating asthma is expensive, not having to treat it saves money. In a bigger context, and maybe touching the game’s underlying metanarrative, if we simply stop poisoning ourselves with CO2 emissions, we could be ready for big strides into the right direction. But we have to act immediately.

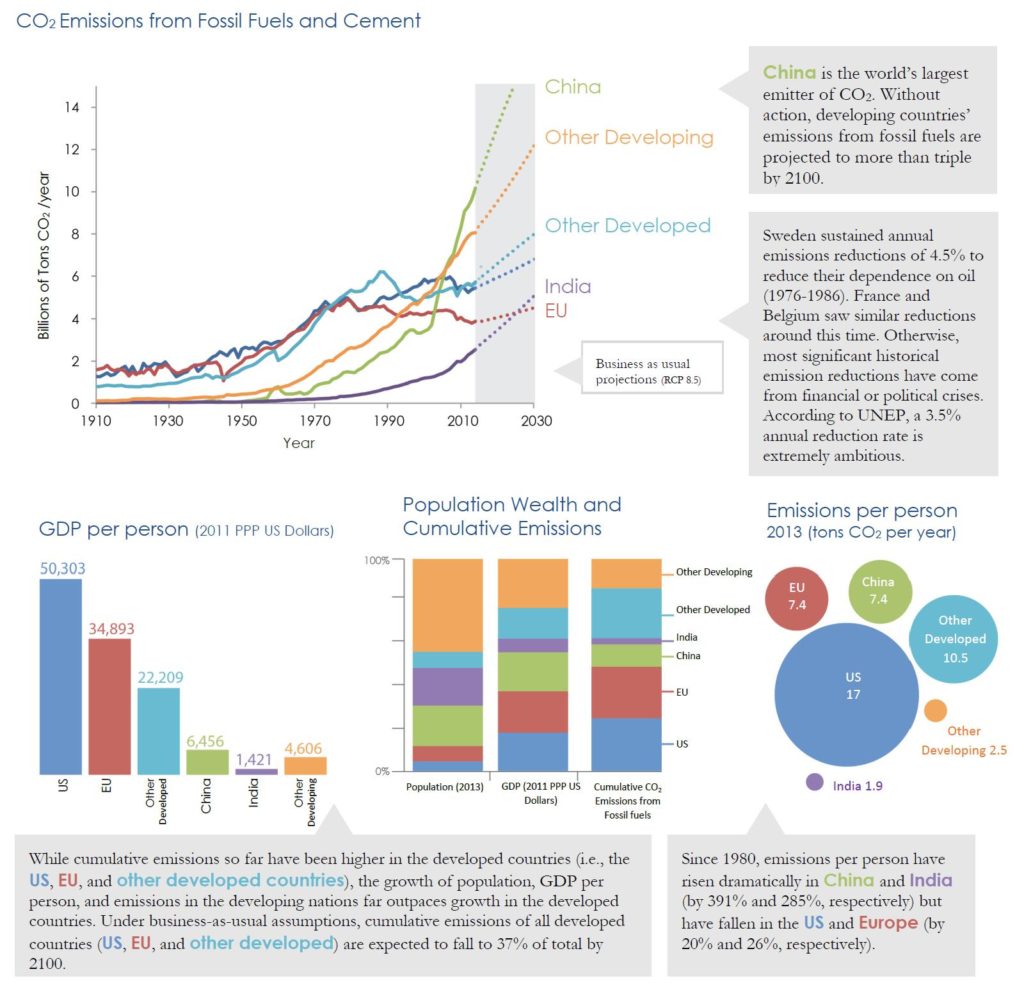
Figure 3 Part of the briefing information for participants

From a didactic point of view, the simulation combines learning about a complex dataset and its interrelated factors with an emotional dimension. Participants play a role, and receive immediate feedback about their negotiation results via the C-ROADS tool. Intense discussions within the countries and country blocs begin to merge with attempts to collaborate across parties. Concepts about climate change, including false concepts, are addressed in a constructive way that allow participants to model and adapt their decision-making to what they learn. It’s a powerful learning and teaching format.

If you want to play the WCS, I believe that the simulation needs a good facilitator to regulate the game dynamics and deliver the Secretary General’s content-heavy input. The teaching notes are very well prepared (see figure 3 for example) and should make it possible for anyone to organize the WCS for the first time. The simulation (in the setting that we played) requires a time slot for about 3.5h-4h. It then gives enough time for a debriefing to summarize the learning experience and let participants reflect on their next steps individually. We had faculty from all levels (Prof, Postdoc, PhD) and master students learning together as participants in the simulation, which added a new opportunity to meet in the department. It was a great learning opportunity!


Information on the simulation, including the full set of slides and materials to play the simulation (also in other languages including German, French, and Italian):

https://www.climateinteractive.org/programs/world-climate/


C-ROADS can be downloaded for free here:

C-ROADS


[1] The event was organized by Johannes Meuer (SusTec) and Erik Jentges (MTEC Teaching Innovations Lab). A huge “thank you!” to Florian Kapmeier for an energetic and passionate facilitation of the simulation.