
The long way ahead for the energy transition
On 22.04.2020 by Viktoras Kulionis
Concerns about the consequences of excessive global warming have increased interest in the energy transition. General belief is that the energy transition has been the dominant factor of the increased use of renewable energy. However, only few countries/regions show evidence of an actual energy transition. At the global level, its relevance is short of non-existent when you do the math.
Energy use accounts for approximately two-thirds of the world’s GHG emissions. This is because most energy still comes from the combustion of fossil fuels (mainly oil, coal, and natural gas). The energy transition, i.e. the shift from non-renewable to renewable sources of energy, has been put forward as a potential solution to global warming. A recent study decomposed the different contributors to changes in the use of renewable energy (RE) around the world. It included the substitution of non-RE by RE as a variable termed “energy transition” to gauge the actual impact of the energy transition itself in comparison to other drivers such as: consumption per capita; population; technology; and trade structure. This is what it found.
Which factors drive global renewable energy use?
Figure 1 shows the cumulative drivers for changes in global RE use and the total change over 2000–2014. Negative values indicate that the driver decreased RE use, and vice versa. The total change (black line) is the sum of positive and negative drivers. The typical output tells by how much the global RE use would have increased if only population, for example, had increased as it actually did, while everything else had remained the same.
Global RE use increased 38% between 2000 and 2014 or 22.1 Exa Joules (EJ). To put this into perspective, total final energy consumption in the US was about 63 EJ in 2014. As shown in Figure 1, changes in consumption per capita (+32.2 EJ) and population growth (+11.0 EJ) were the major contributors to this change.
What does that mean? More people and more consumption by each of them were responsible for a substantial growth in demand for RE. If everything else, besides population and consumption per capita, had remained constant, global RE use would have increased by 43.2 EJ (75%) since 2000.
This effect was partly offset by changes in technology (which includes efficiency gains and changes in the input structure of production) that accounted for -23.6 EJ (-41.8%) reduction in RE use. Thus, the energy needed to produce the same amount of goods and services declined overtime – we can obtain more from less.
The contribution of non-RE substitution by RE (i.e. energy transition) was very modest accounting only for 1.3 EJ (2%). This implies that, at the global level, both RE and non-RE use grew at a very similar rate with the RE use growing only marginally faster. In principle, we would like this effect to be higher as it would indicate that RE use replaces non-RE use.
Despite unprecedented change in the level and pattern of international trade, its effect on global RE use was very small, increasing it by just 1.1 EJ (2%).
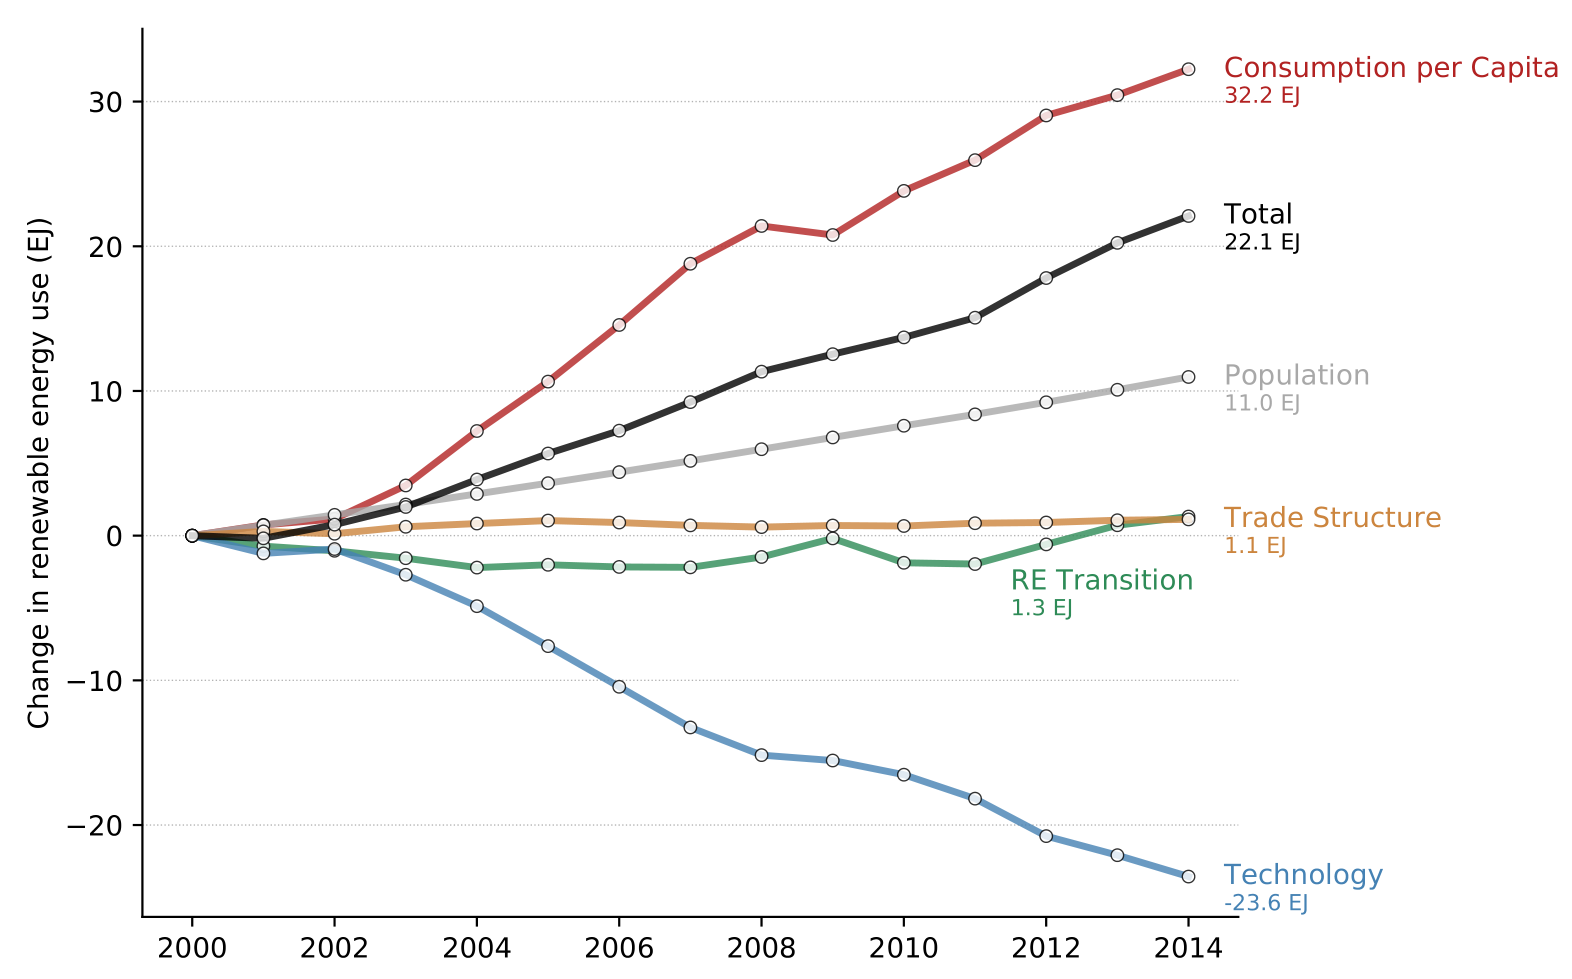
Figure 1: Cumulative change in global RE use by driving factor, 2000–2014.
Which countries/regions drive global RE use?
Figure 2 shows the changes in RE use between 2000 and 2014 by country and driver.
Changes in European countries (EUR, i.e., EU28 + Norway and Switzerland) increased global RE use by almost 4.2 EJ (indicated by the line in Figure 2), about 19% of total change in global RE use.
The growing importance of the rest of the world (ROW) region, which consists mostly of developing and emerging countries, is remarkable. Its RE use increased by 8.9 EJ (i.e. 40% of total change in global RE use) making it the highest contributor to the growth in global RE use. In these countries, most of the growth in RE comes from traditional fuels such as firewood and agricultural waste biomass. Usually, as income rises, countries move away from reliance on traditional fuels to more sophisticated energy carriers, in a process known as “climbing the energy ladder”.
Growth of RE use in other major economies was considerably lower. Changes in India accounted for 2.1 EJ (9.5%), in the USA 1.8 EJ (8.3%), in Brazil 1.65 EJ (7.5%), and in China 1.29 EJ (5.8%) increase of global RE use.
What drives RE use at the country/region level?
Figure 2 shows that the role of five drivers differs between countries and regions. Growth in consumption per capita was the main contributor for the growth of RE use in BRIIC countries (Brazil, Russia, India, Indonesia, and China) and the ROW. Population growth in the ROW is significant, too. For China, this effect played a minor role, reflecting a slowdown in its demographic change.
Global changes in consumption per capita and population have had a minor effect for the increase of RE use in European countries (EUR), the USA, and East Asia. In these countries/regions the RE transition effect had a strong positive influence on RE use. This effect was especially strong in the EUR, which reflects the commitment of these economies to reduce their environmental pressure by promoting RE use.
In contrast, in China and India we see decreasing shares of RE in total energy use. This does not imply that the energy transition has reversed (i.e. changed from renewable to non-renewable). Rather, it expresses that RE use grew less than non-RE use. As economies industrialize, their energy requirements tend to increase significantly in order to build infrastructure: roads, bridges, houses and heavy industry. These projects use material inputs such as steel and cement, production of which require large amounts of fossil energy. Material requirements are likely to decline in China in the very near future, but increases are anticipated in India, other developing Asian countries, and sub-Saharan-Africa.
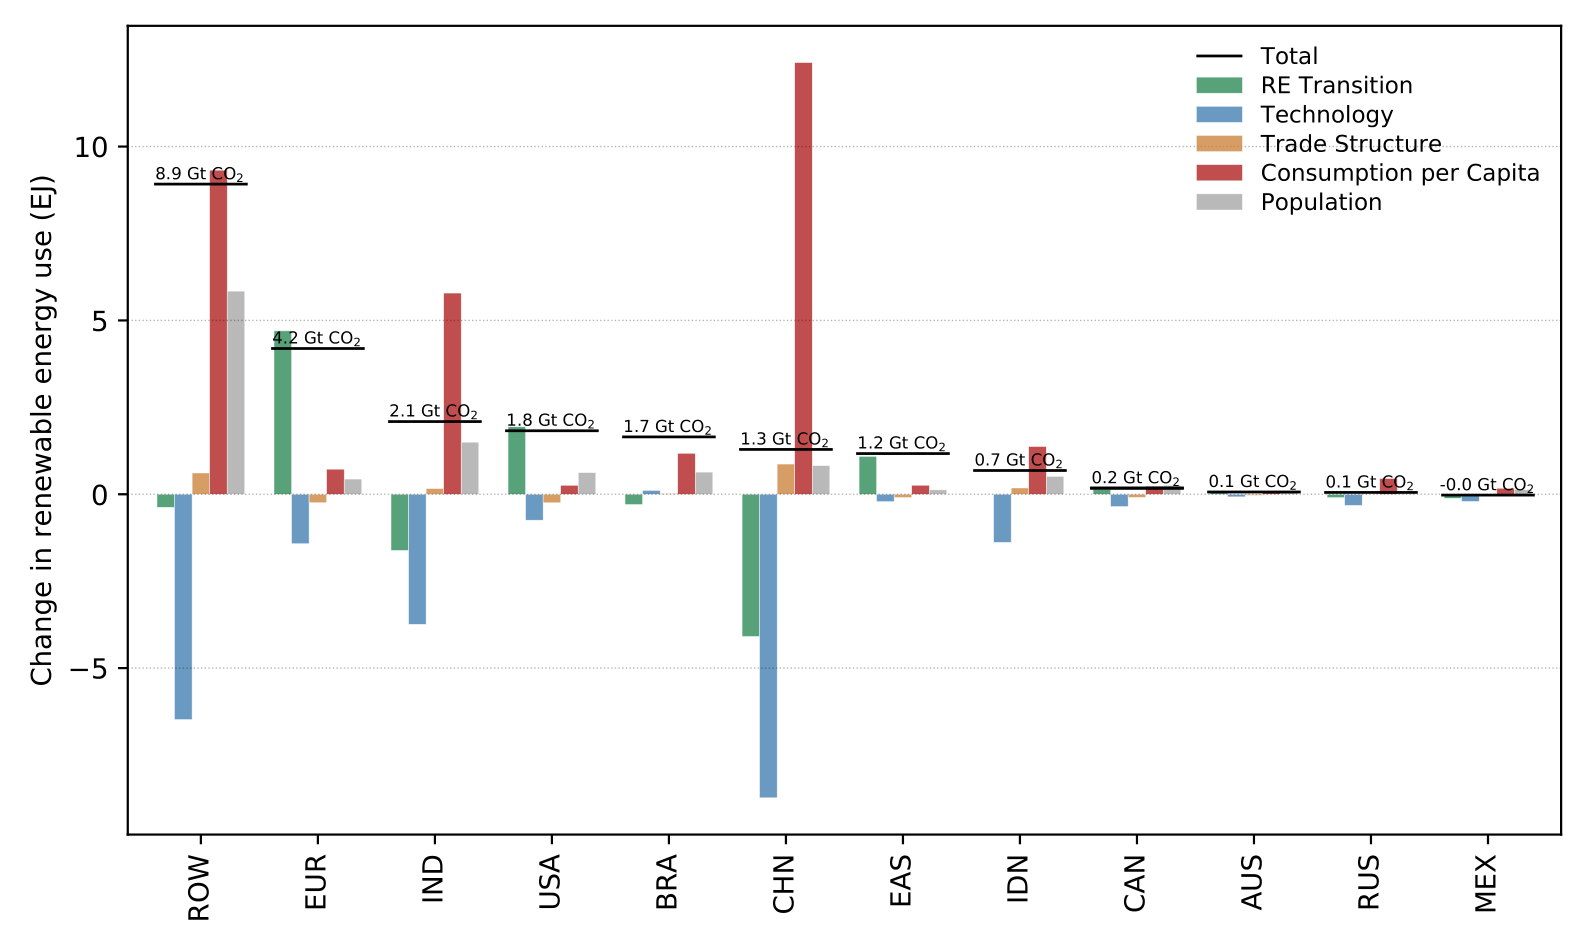
Figure 1: Changes in RE use by country/region and driving factor, 2000–2014. Note: ROW – Rest of World; EUR – EU28 + Norway and Switzerland; IND – India; USA – United State of America, BRA – Brazil, CHN – China; EAS – East Asia; IDN – Indonesia; CAN – Canada; TUR – Turkey; AUS – Australia; RUS – Russia; MEX – Mexico.
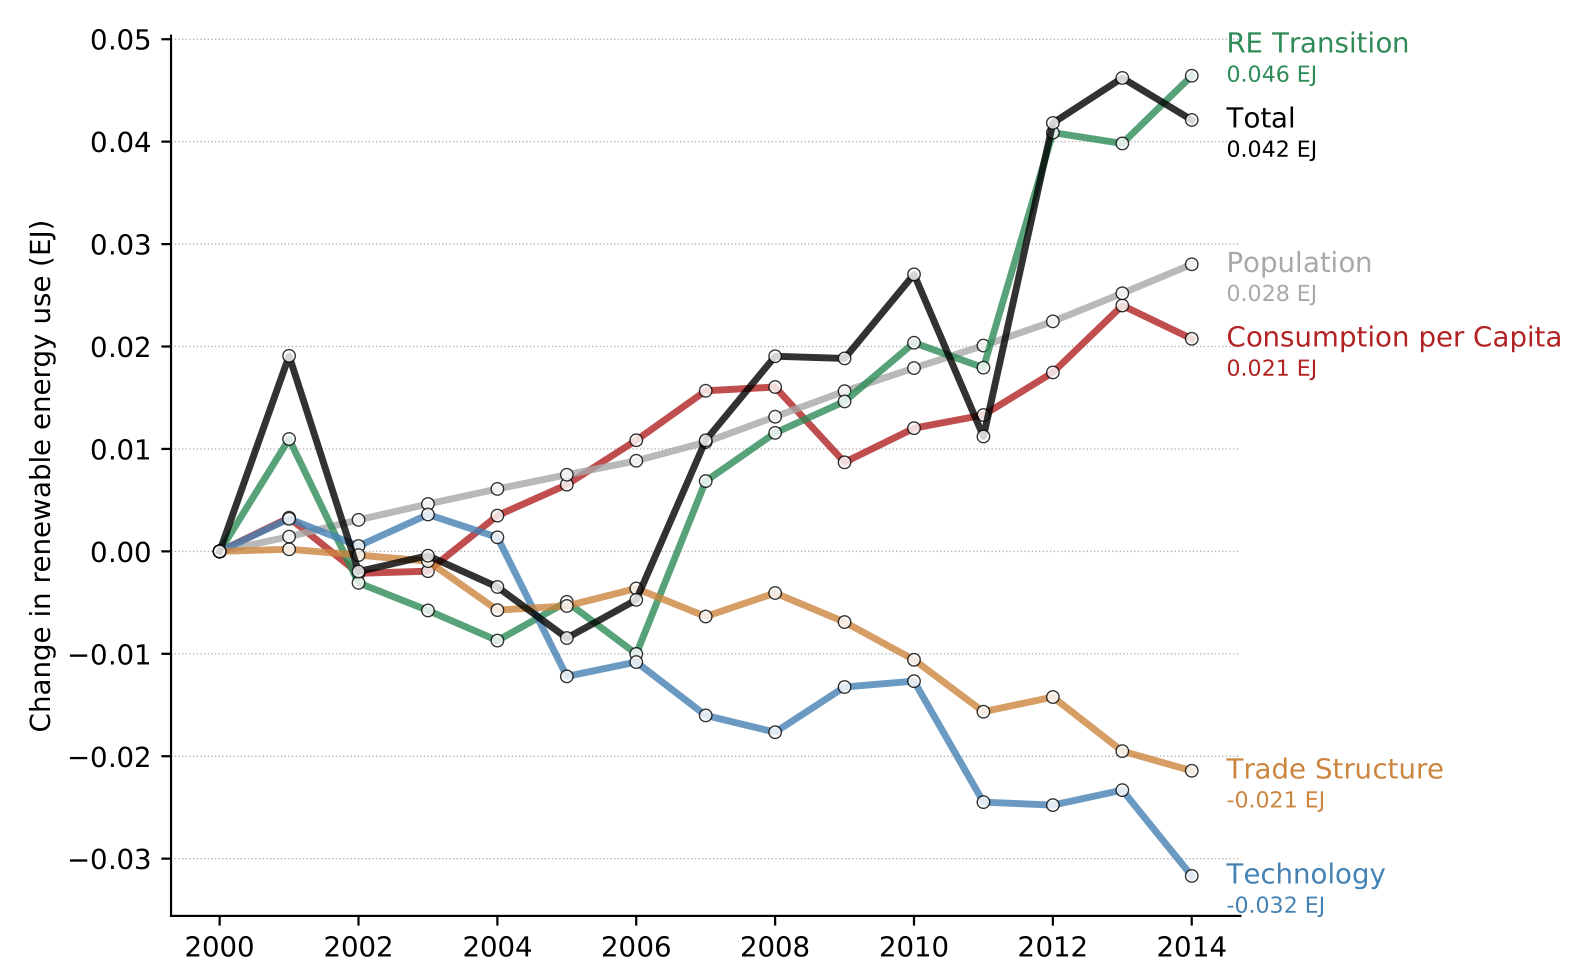
What drives RE use in Switzerland?
The results for Switzerland displayed in Figure 3 are in line with the findings for the EUR. The energy transition effect was the most important component driving RE use. In Switzerland, the consumption per capita effect is relatively low and even smaller than the population effect. This reflects the decoupling of energy use from economic growth (proxied by consumption per capita). The trade structure effect also plays an important role in Switzerland. It captures changes in RE use due to the decreasing use of domestic inputs (outsourcing) which are replaced by imports.
Conclusions
These results are both hopeful and worrying. Hopeful, because they demonstrate that environmental policies are displacing fossil fuels in several parts of the world. Worrying, because the energy transition in these countries is too slow, and because energy transition efforts in industrialized countries are far from enough. The deployment of renewable energy worldwide needs to accelerate.
Vaclav Smil writes that all energy transitions have one thing in common: they are prolonged affairs whose duration is measured in decades or generations, not in years. The greater the scale of prevailing uses and conversions to change, the longer the substitutions will take.
Energy history contains many stunning examples of these affairs. The major global energy transitions from wood to coal to oil and natural gas have each taken roughly 50 to 60 years. Take natural gas, for example, it took about 60 years since the beginning of its commercial extraction in the early 1870s to reach 5% of the global energy market, and then another 55 years to account for 25% of all primary energy supply.
The energy industry is complex, and understanding the major trends can be challenging. A key question for the 2020s is whether the energy transition will be gradual or rapid. Smil argues that the great hope for a quick and sweeping transition to renewable energy is wishful thinking. Others are more optimistic because renewable energy is getting obscenely cheap. One thing is clear, the challenge ahead is immense and the next decade will be crucial in determining the pace of the transition.
Nevertheless, in my eyes, betting on renewables alone to prevent global warming is a risky strategy. If we treat climate change as the world’s biggest threat, then all technologies and carbon free energy sources should be considered as viable options, including nuclear. Existing evidence suggest that a broad portfolio of energy options will facilitate an affordable transition to a near-zero emission energy system. Any visions of a rapid, reliable, and low-cost energy transition that relies almost exclusively on wind, solar and hydroelectric power should be treated with caution. To quote a prominent energy and climate scientist Glen Peters: “It is still possible to win if you have 9 players on the football / soccer field, but it is a lot easier to win if you have 11…”
Cover photo by Martin Pruskavec on Unsplash.
Yes, the new focus must be on emissions and not on energy. The label „Energy City“ (Citation: „Energy cities promote renewable energies, environmental friendly transportation and focus on an efficient use of resources.“) should be relaced by „Carbon Neutral City“ (Own Definition: No Coal, No Oil, No Gas, Carbon neutral Cement/Steel).
There are many ways to avoid CO2-Emissions. Besides rewnewables there is the possibility of using carbon neutral construction materials, the possibility of Buildings which do not need energy for climatisation or heating in the winter and
there is the possibility of Carbon Free Electricity by several means: 1) electricity can be transported over thousands of miles and can therefore connect CO2- free electricity sources and users which are thousands of miles apart 2) electricity can be produced by new advances nuclear reactors which can use spent nuclear fuels as input, which are inherently safe and which do not need expensive decommission operations.
In my opinion, we must act now. Waiting on new technology like hydrogen as backup and seasonal storage is the wrong decision, because new technologies like hydrogen storage take many decades to build up. Time we just do not have.