
Understanding the carbon footprint of your daily commute: a guide to climate-friendly urban transport
On 19.07.2023 by Romain Sacchi, Christian BauerBy Romain Sacchi and Christian Bauer


Romain joined the Technology Assessment Group at the Paul Scherrer Institute in June 2019 as a PostDoctoral Researcher, to contribute within the field of life cycle assessment applied to future mobility technologies. More specifically, Romain investigates the opportunities and challenges related to the electrification of mobility in general, considering all the environmentally-relevant phases along the life cycle of transportation services.
Christian has been working in the Technology Assessment group since 2004. His main research areas are Life Cycle Assessment (LCA) and sustainability assessment of current and future electricity and heat supply, energy storage, carbon dioxide removal as well as conventional and innovative transport systems. Within the Laboratory for Energy systems Analysis (LEA), he is responsible for the management of LCA projects and LCA related aspects in multi-disciplinary activities of the laboratory.
You are probably aware that your daily commute contributes to climate change. But just how much? In this blog post, we offer a detailed look at the carbon footprint of various transport modes, from bicycles and scooters to cars and public transit. Learn how everyday choices can significantly affect your impact on the environment and discover more sustainable options for urban mobility. We also showcase user-friendly tools that you can use for free to give you a comprehensive understanding of the environmental impacts of your transport choices. Ready to make greener choices? Let’s dive into the findings together!
One of the most significant challenges of our time lies in creating sustainable transport systems. As our cities grow and flourish, so does our need for travel. The problem? Increased travel often means higher energy use, more greenhouse gas (GHG) emissions, and greater environmental impacts. For example, in Switzerland, passenger transport represented close to 22% of the country’s emissions of GHG in 2022, or more than 20% that of an average Swiss resident.
To help put numbers on the issue, our research group at the Paul Scherrer Institute (PSI) has developed easy-to-use tools for a wider audience, to understand the environmental impacts of various transport modes from a life-cycle perspective, such as mobitool and carculator.
These tools provide a comprehensive picture of environmental impacts, considering each phase of the life-cycle of these transport services: from the manufacturing, assembly, and use to their maintenance and disposal phases, and compare them on a similar basis, such as the transport of a passenger over one kilometer (referred to as a passenger-kilometer, or pkm). And the best part? They cover a broad range of mobility options to allow for direct comparisons, which helps us all make better, more sustainable transport choices.
Comparison of transport modes
So, let’s compare different modes of passenger transport relevant to urban mobility, in terms of emissions of GHG, for transporting one passenger over one kilometer. These include passenger cars, buses, trams, scooters, and both electric and conventional bicycles (see Figure 5 at the end of this blog post for a comparison across all modes).
Starting with “soft mobility” (see Figure 1), conventional bikes have the lowest carbon footprint at around 5 gCO2e/pkm. If additional food intake is considered, (in this case, assumed to be wheat-based) their footprint increases to 20 gCO2e/pkm, slightly above the footprints of e-bikes and cargo-bikes. We noted down methodological details regarding energy assumptions (food and electricity) at the end of the blog post. Electric kick-scooters, or trottinettes, have a higher carbon footprint of ~45gCO2e/pkm due to their short lifespan, not their energy consumption. However, increasing their lifespan (e.g., to 3,000 km) can help reduce this number to levels comparable to bicycles.
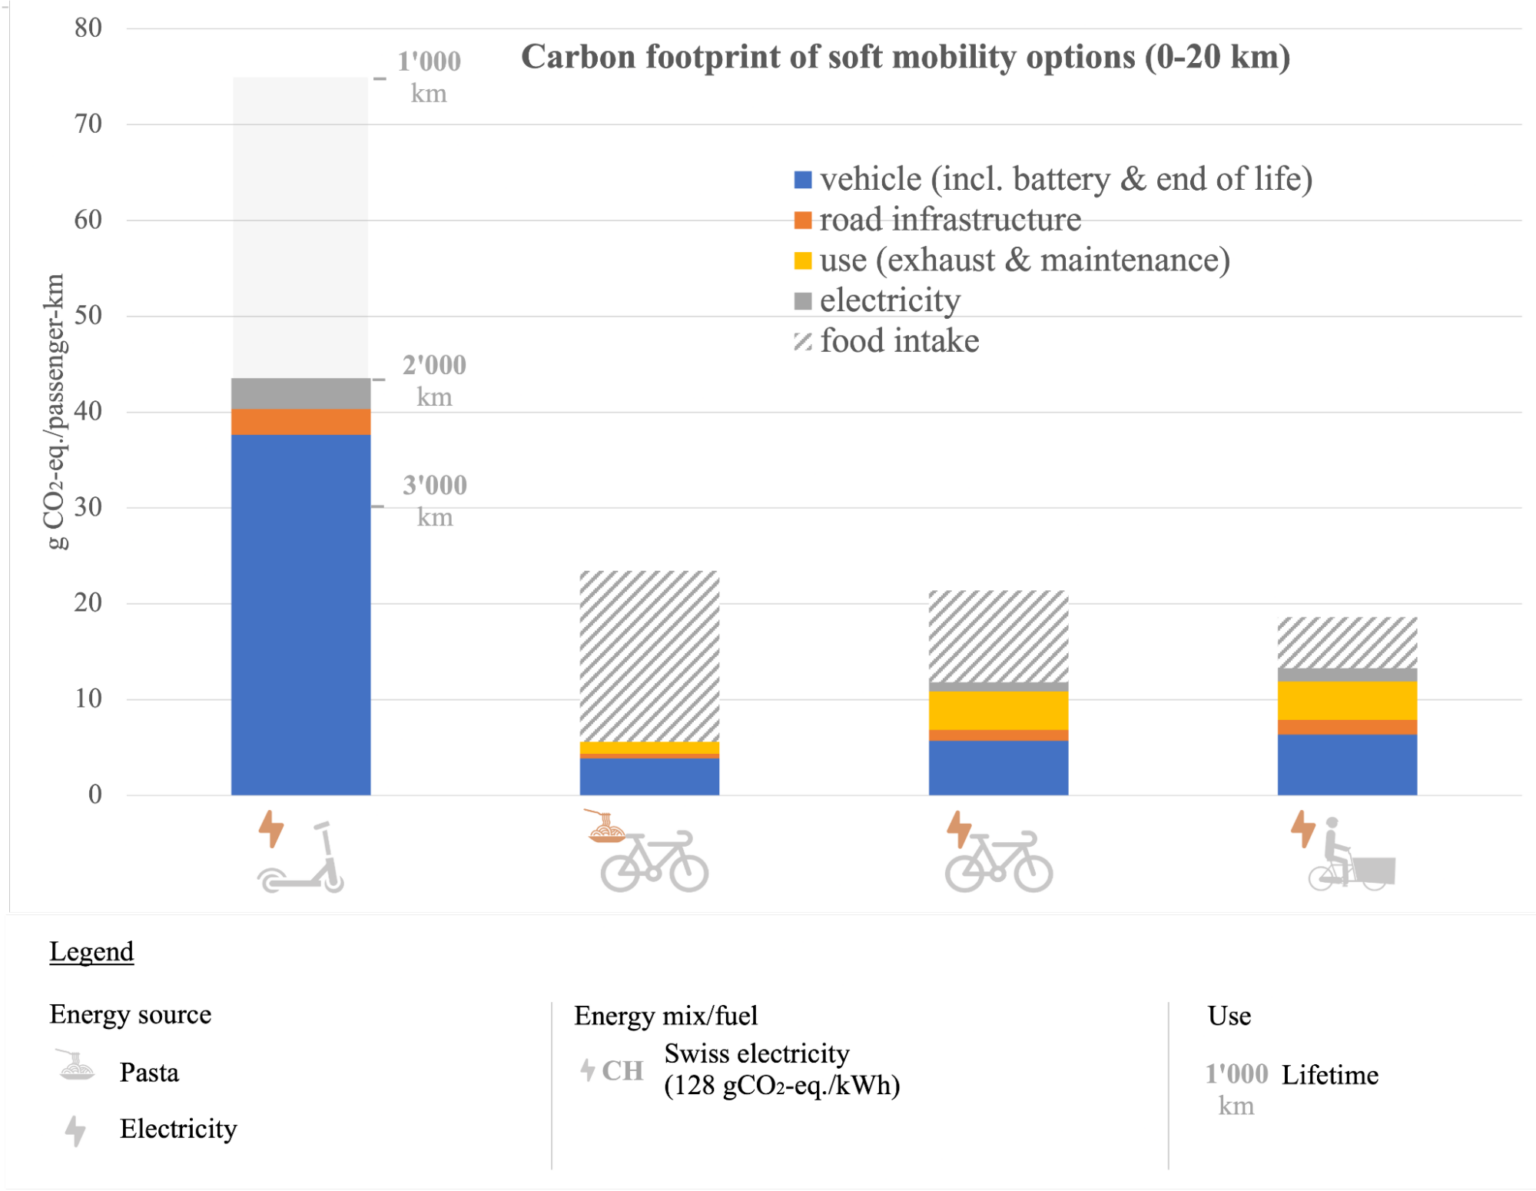
Figure 1 Carbon footprint per passenger-kilometer for “soft” mobility options. Underlying input values reflecting average Swiss conditions are used (e.g., electricity mix). The food intake is wheat-based (e.g., pasta). The caloric intake without electric assistance is assumed to be 25 kCal per km. The regular and cargo electric bicycles reduce the food intake by 46% and 70%, respectively. Bars for food intake hatched as it is unclear if commute biking increases food intake. Methodological remarks at the end of the blog post. Source: mobitool v.3.0 and Alessio et al., 2021.
Gasoline-powered scooters and motorbikes are a completely different story. They have a considerably higher carbon footprint compared to the soft mobility options – see Figure 2. Specifically, a small gasoline scooter can have a carbon footprint as high as 160 gCO2e/pkm, while mid-size engines produce about 130 gCO2e/pkm. Note that certain scooters and motorbikes can be adapted to use up to 85% bio-ethanol (E85). This fuel can help reduce GHG emissions provided it is produced with biomass waste, which is unfortunately limited in supply. The most efficient lever for reducing the GHG emissions of two-wheelers in Switzerland, besides bicycles, are electric scooters. With a low-carbon electricity, they yield values ranging from 60 to 75 gCO2e/pkm, depending on their size and power.

Figure 2 Carbon footprint per passenger-kilometer for two-wheelers. Underlying input values reflecting Swiss conditions are used (e.g., electricity mix, gasoline blend). Biomass residues are assumed for bio-ethanol production. Source: mobitool v.3.0.
Let’s move on to passenger cars. The carbon footprint of cars depends on factors like size, fuel consumption and passenger occupancy – see Figure 3. Read our methodological note below about passenger occupancy. A gasoline or diesel-powered car’s carbon footprint can be anywhere from 110 to 230 gCO2e/pkm (Figure 3, second and fourth). Electric vehicles have the lowest carbon footprint among cars, but it greatly depends on the source of electricity used to charge the car. With low-carbon electricity, a mid-size electric car’s footprint can be as low as 65 gCO2e/pkm (Figure 3, third). If the electricity comes from a coal-fired power plant, the footprint could rise to 300 gCO2e/pkm. Please note our remarks regarding electricity consumption at the end of the blog post. Over time, as the electricity grid becomes cleaner in most places, the footprint of electric cars will decrease further. Importantly, larger electric vehicles (Figure 3, first from the right) have a higher carbon footprint than smaller ones, and provide limited benefits compared to a small gasoline car (Figure 3, second from the left, ~20% reduction) – something to keep in mind when looking for your next vehicle. This highlights the need to reduce the vehicles’ mass besides electrifying them. Finally, plug-in hybrid vehicles (Figure 3, second from the right): these can be as climate-friendly as battery electric vehicles, if the vast majority of trips is short enough to be driven in electric mode. However, if these cars are only used for long distances or the battery is not charged, their carbon footprints can even exceed those of conventional cars due to the additional weight of the electric powertrain (i.e., battery and motor)..
The most efficient emissions reduction lever for passenger cars is probably the electric micro-car (e.g., Microlino): this two-seater is perfectly adapted for urban mobility and can help reduce GHG emissions by a factor four, compared to a gasoline SUV.
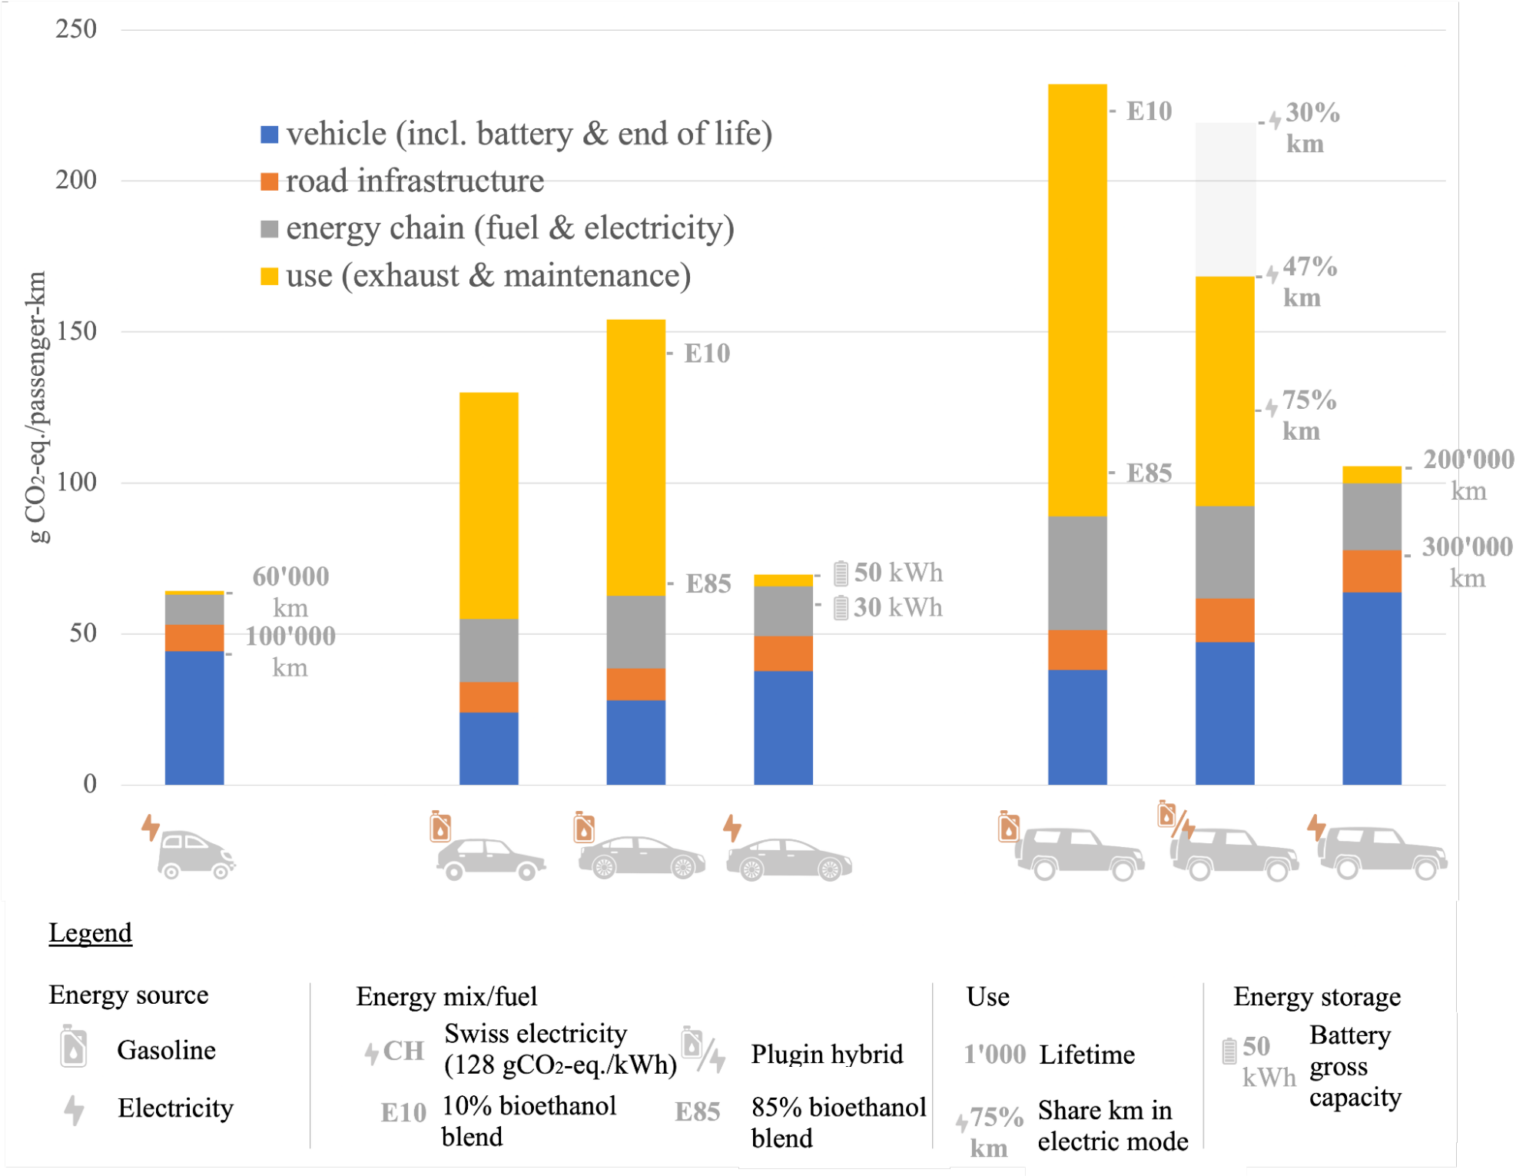
Figure 3 Carbon footprint per passenger-kilometer for passenger cars. Underlying input values reflecting average Swiss conditions are used (e.g., electricity mix, gasoline blend). Average occupancy rate of 1.5 passengers assumed. Source: mobitool v.3.0.
Finally, let’s have a look at city buses and trams. The carbon footprint of these can vary significantly depending on factors like fuel type, size, and occupancy rate – see Figure 4. Diesel buses can have a carbon footprint ranging from 90 gCO2e/pkm for the largest ones (i.e., articulated, 18m-long) to 170 gCO2e/pkm for the smallest ones (i.e., 9m-long, “midibus”). Electric buses perform better, with a carbon footprint ranging from 40 to 80 gCO2e/pkm (i.e., depending on the charging strategy: depot vs. opportunity-charging). The greenest star in the urban collective transport scene is probably the light-rail train (i.e., “S-bahn”), followed by the trolleybus with in-motion charging, boasting a carbon footprint of 10 and 30 gCO2e/pkm, respectively. Besides electrification, increasing the occupancy rate is another powerful lever for reducing GHG emissions of collective transport.
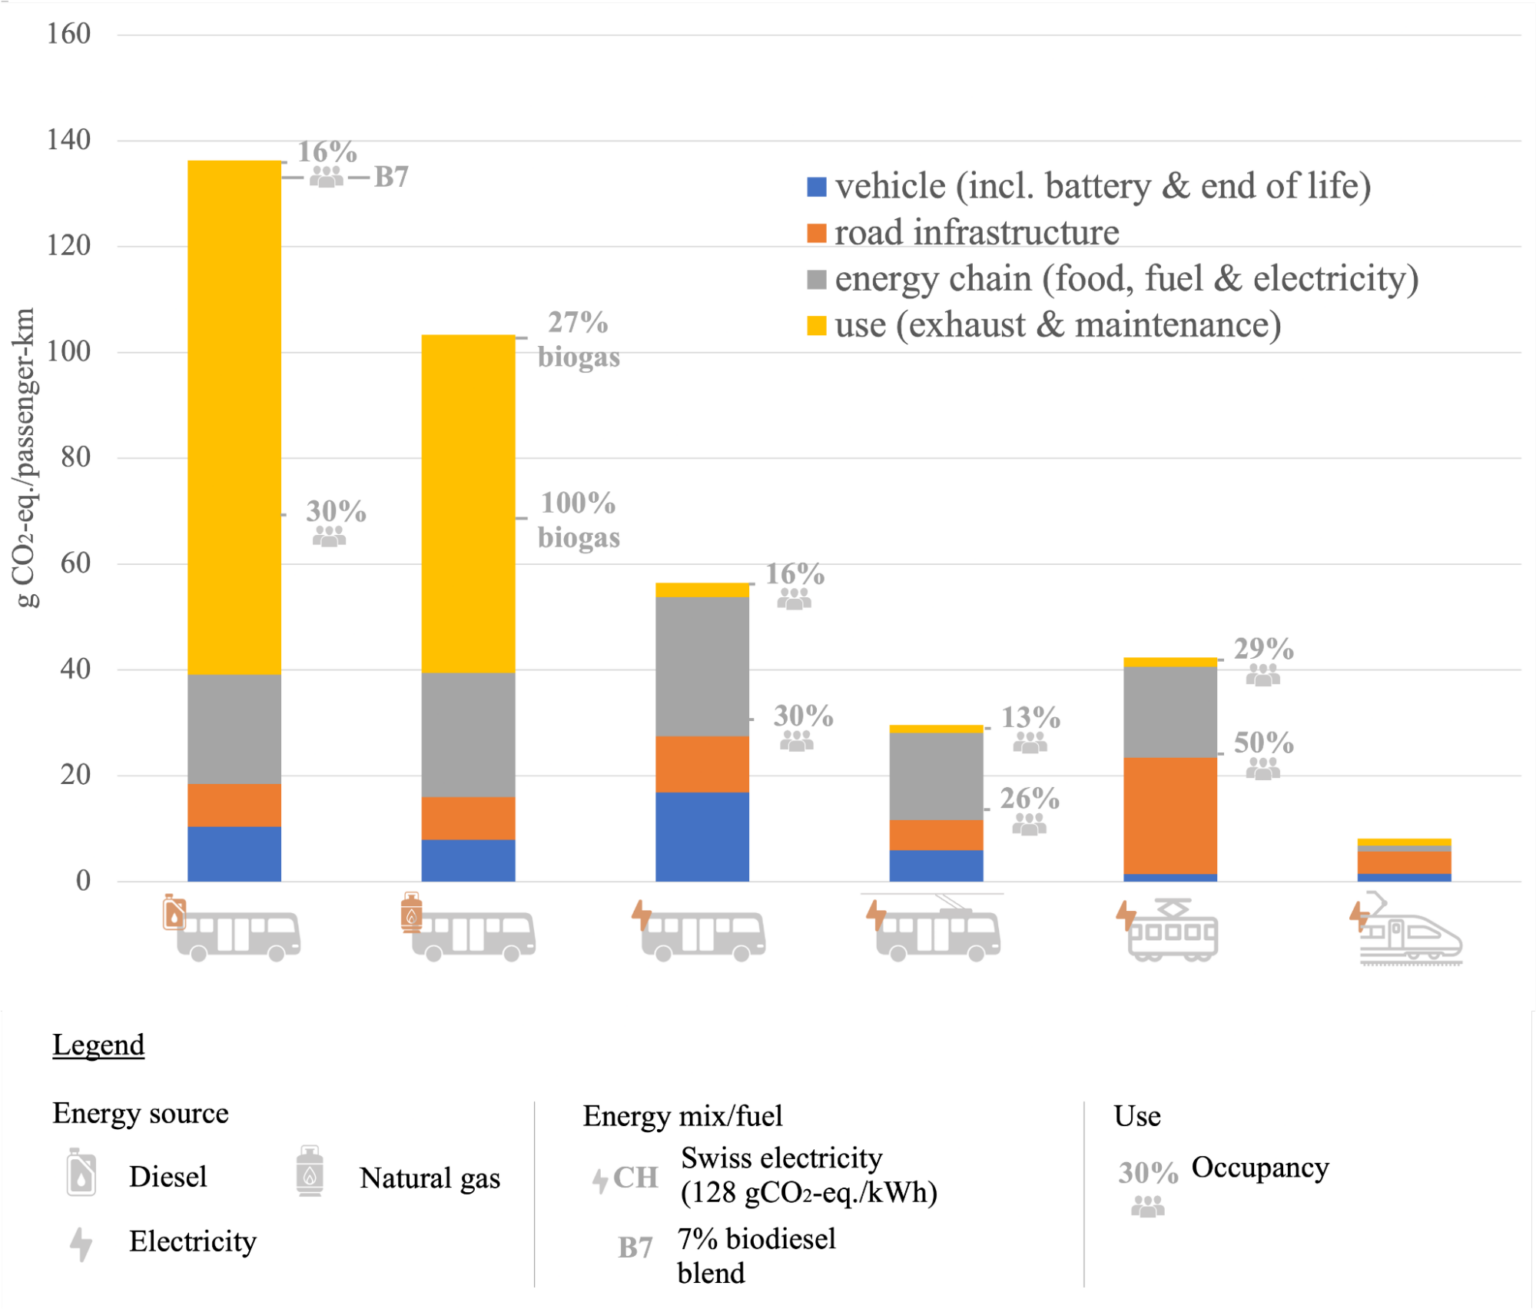
Figure 4 Carbon footprint per passenger-kilometer for collective passenger transport. Underlying input values reflecting average Swiss conditions are used (e.g., electricity mix, natural gas and diesel blends and occupation rates). Source: mobitool v.3.0.
In conclusion, when considering the carbon footprint of various forms of transportation, we find a diverse range of impacts – see Figure 5. Biking (with or without assistance) is the least carbon-intensive transport method for short distances, producing close to no emissions. For medium distances, they can be combined with public transit systems like buses, trams, and trains, which emit less carbon per passenger than personal vehicles. Finally, electric cars can be used for longer distances. Charged with low-carbon energy sources, they considerably cut emissions compared to gasoline or diesel counterparts – but those remain substantial if the vehicle is oversized. We should also not forget about the co-benefits of electric vehicles such as reduced noise and air pollutant emissions, especially in urban environments.
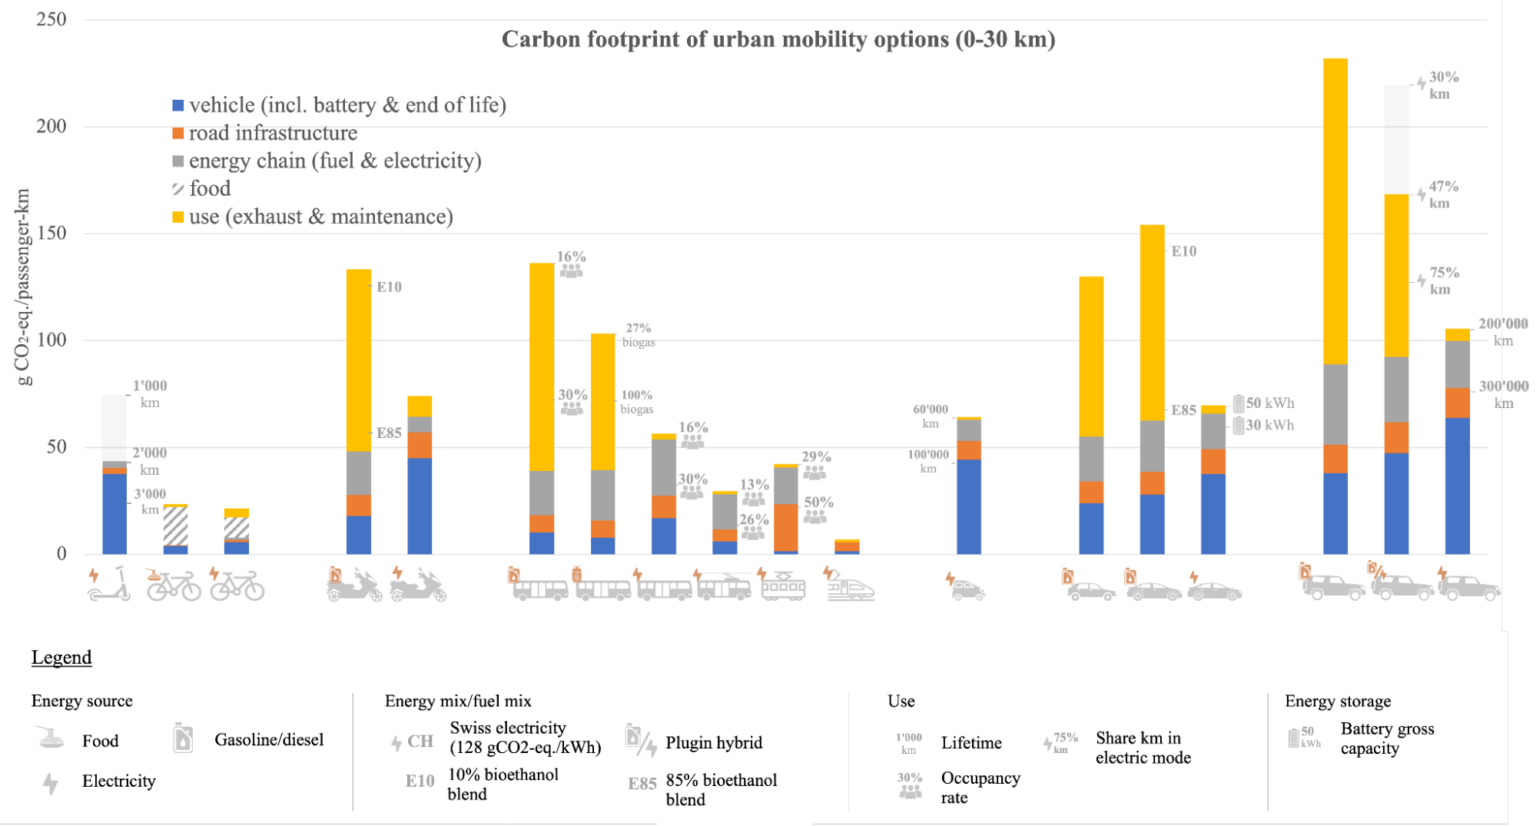
Figure 5 Carbon footprint per passenger-kilometer for different means of transport in the urban environment. Underlying input values reflecting average Swiss conditions are used (e.g., electricity mix, occupancy rate, fuel blend, annual mileage, etc.). Source: mobitool v.3.0.
It’s crucial to remember that specific circumstances can influence these general rankings. The goal for reducing transportation emissions should focus on choosing lower-emission modes, increasing passenger occupancy for mass transit, enhancing vehicle efficiency, and shifting towards cleaner energy sources. We can all play a part in this by making more informed and sustainable transportation choices. Did we spark your curiosity? Download a copy of the Mobitool spreadsheet model or alternatively visit our online tool carculator to see the effects of charging electric vehicles with PV power from your own roof, of extending the lifetime of your vehicle, or also check out environmental performances regarding other burdens than GHG emissions.
Methodological notes regarding energy consumption
Food: While any physical activity, including cycling, requires a certain amount of energy – which is supplied either directly by the calories we consume in our diet or in a deferred manner via the breaking down of body fat into glycerol and free fatty acids – there lacks consensus on the causal link between cycling and increased food intake, which is why its contribution is shown as uncertain (hatched in Figure 1).
Passenger occupancy: We consider the Swiss average occupancy of 1.6 passengers per vehicle for all passenger car options. For commuting purposes, the passenger occupancy drops to 1.1 passengers per vehicle, effectively increasing the per passenger-kilometer scores shown in Figure 3 by approximately 45%! This would be a valid consideration if the vehicle was only used for commuting.
Electricity: Any increase in electricity use (i.e., to operate an electric vehicle or bicycle) provided by a network that is part of the European Union’s Emissions Trading Scheme, such as that of Switzerland, should, in principle, not lead to additional direct GHG emissions. In practice, however, an increase in demand for electricity may still lead to additional GHG emissions for various reasons (e.g., use of previously banked emission allowances, emissions embodied in the infrastructure of renewable plants, etc.). Also, in our view, not accounting the burden associated with electricity use would break the physical and causal relation between the final user and the supply chain. In other words, users of electric vehicles must take responsibility for their share of total emissions from the electricity sector.
Cover image: (Adobe, Photograph)
Keep up with the Energy Blog @ ETH Zurich on Twitter @eth_energy_blog.
Suggested citation: By Romain Sacchi, Christian Bauer. “Understanding the carbon footprint of your daily commute: a guide to climate-friendly urban transport”, Energy Blog @ ETH Zurich, ETH Zurich, July 19th, 2023, https://blogs.ethz.ch/energy/daily-commute-carbon-footprint/
If you are part of ETH Zurich, we invite you to contribute with your findings and your opinions to make this space a dynamic and relevant outlet for energy insights and debates. Find out how you can contribute and contact the editorial team here to pitch an article idea!
Leave a Reply