A Bayesian Mixing Model to Unravel Isotopic Data and Quantify Trace Gas Production and Consumption Pathways for Timeseries Data
The recently developed FRAME (isotope FRactionation And Mixing Evaluation) interface is a much needed first step towards a robust community tool to quantify N2O production and consumption pathways from isotopic data including clearly defined quantification of uncertainty (Lewicki et al., 2022). FRAME uses a Markov Chain Monte Carlo approach to simultaneously determine mixing between N2O from different sources as well as the extent of reduction, with an estimate of uncertainty. This modelling approach has been designed and validated for identification of N2O production pathways and quantification of N2O reduction progress in soil incubation experiments. However, FRAME can currently only be applied to discrete datasets; analysis of mixing between pathways across a timeseries generated from a field or laboratory experiment is not possible, except by considering all time points as independent and thus losing timeseries information.
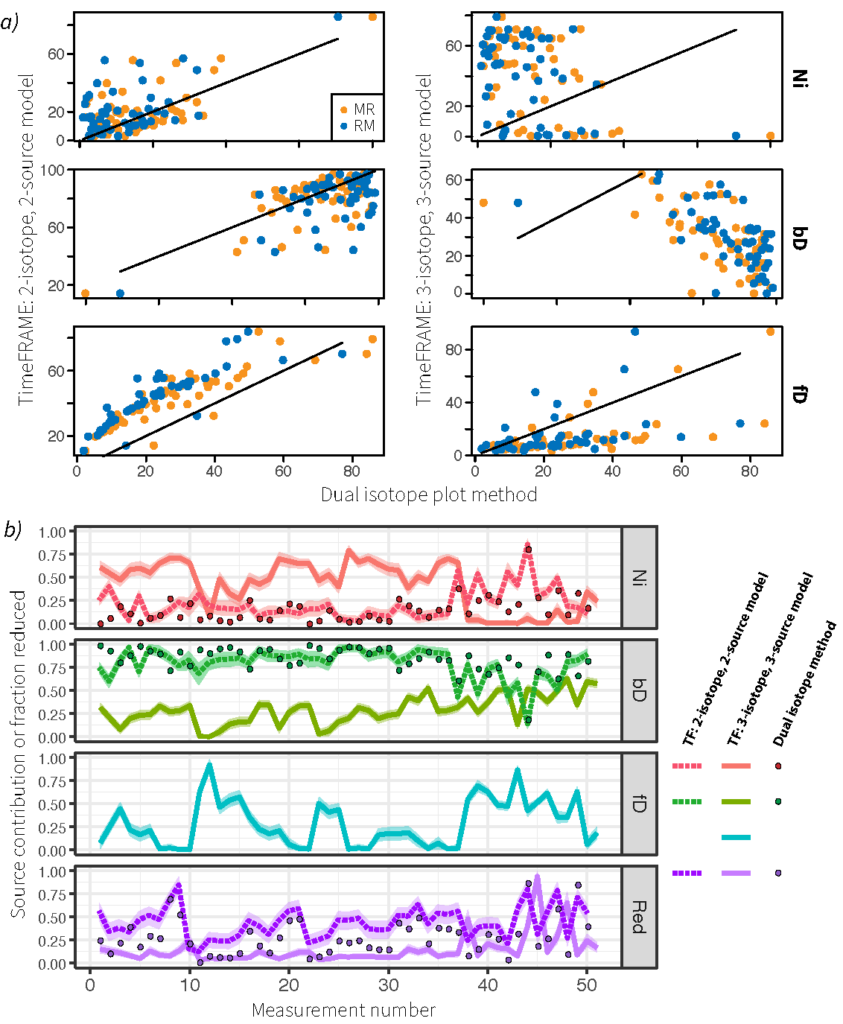
We developed TimeFRAME to address this problem, and implement FRAME with autocorrelation between points along a defined dimension, usually time. TimeFRAME was developed by Philipp Fischer for his MSc at ETHZ:
Following on from Philipp’s MSc thesis, we conducted additional testing of TimeFRAME and released a code package and a manuscript describing its use. If you are using or would like to use TimeFRAME, we look forward to hearing about your experience, questions, comments, difficulties… please get in contact with us! We hope to continue improving and extending TimeFRAME in the coming years.

