
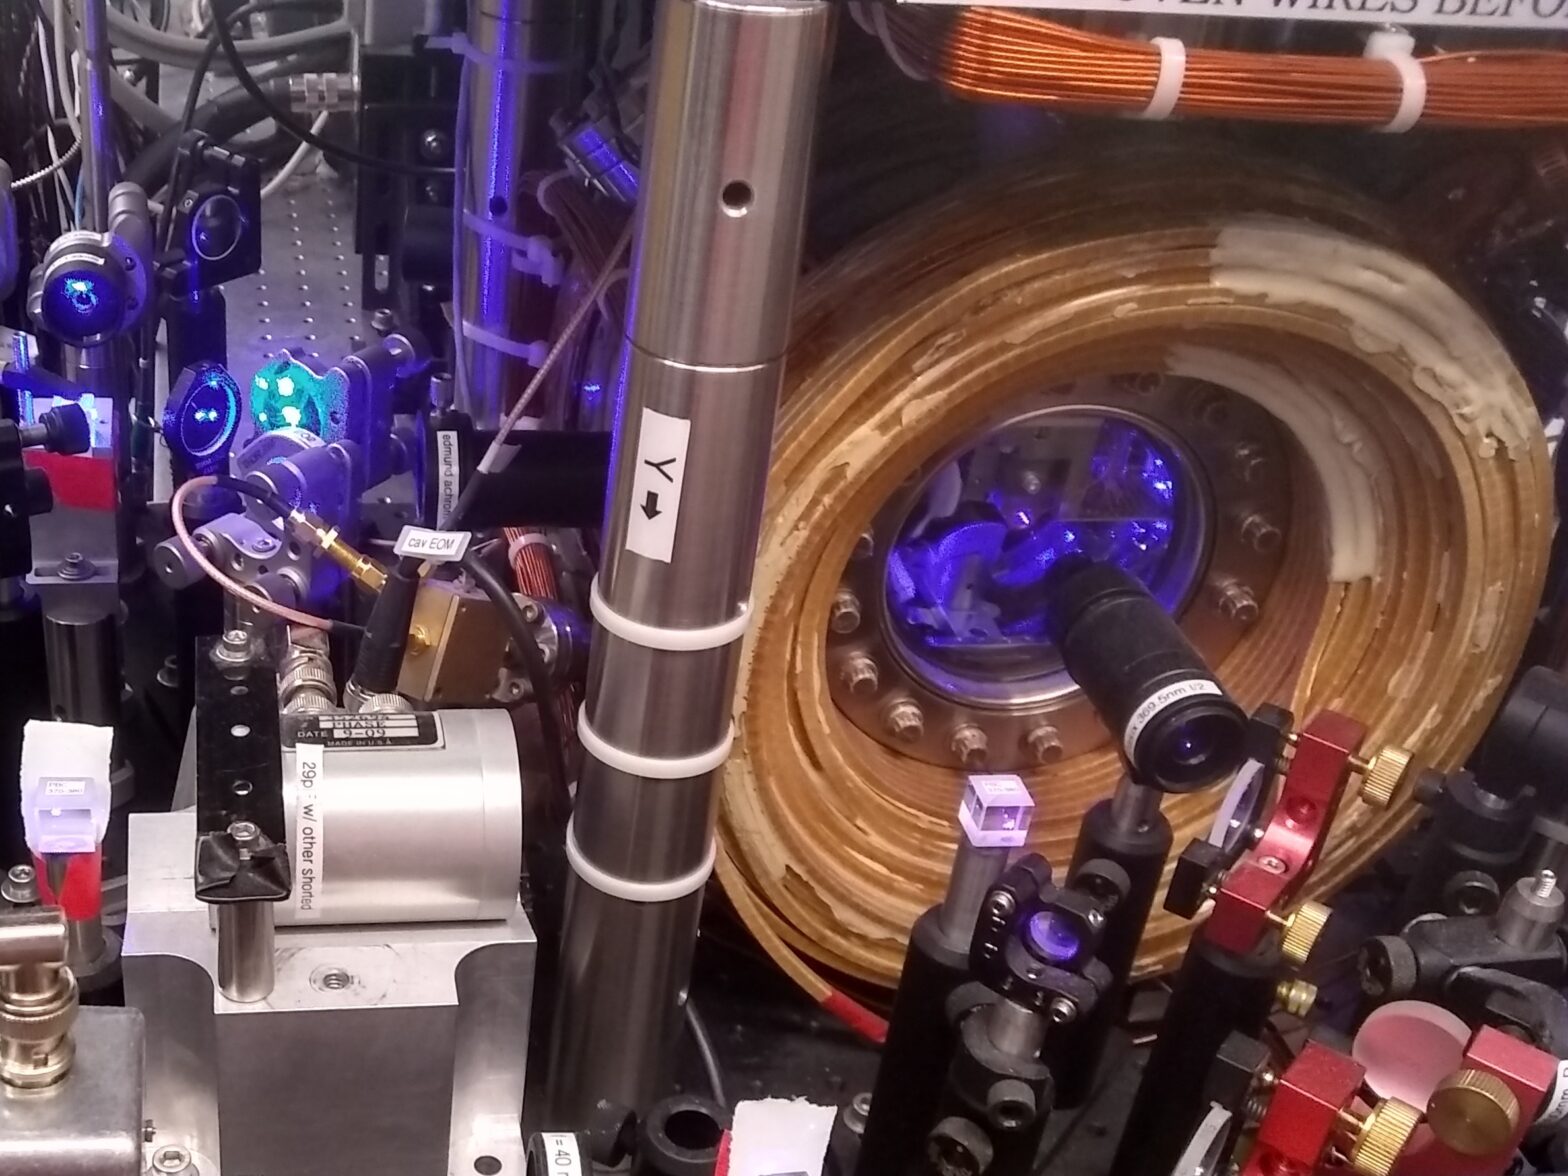
Our new paper, entitled “Observation of 3σ Nonlinear Isotope Shift in Yb+ Search for New Boson”, has just been posted online here today! The work described in our paper was done by a team of researchers in the Vuletic Group’s Ion Lab, at the Center for UltraCold Atoms at MIT, with input from collaborators at other institutes. In this post, I’ll give a summary of our new results and some background, aimed at general audience (for readers in the field, there are also some links to more specialized material). The research we do in this lab involves trapping single ions (positively charged atoms) – to learn more about how we do that, see this post.
Isotopes are atoms of the same element that are identical except for having different numbers of neutrons in their nucleus. It turns out that by measuring small differences in the energy level splittings of isotopes, we can search for new kinds of particles. In particular, we are looking for new force-carrying bosons, particles that can carry, or mediate, forces between other particles. Finding new force-carrying bosons could reveal the origins of dark matter and how it interacts.
Dark matter is one of the most mysterious puzzles in physics today. From astrophysical measurements of how galaxies rotate, we know that it exerts gravitational pull on the matter around it, but we do not know what it is made of or how it came to exist. It accounts for a whopping 85% of matter in the universe but, aside from its gravitational interactions, we do not know of any mechanism by which it interacts with normal matter.
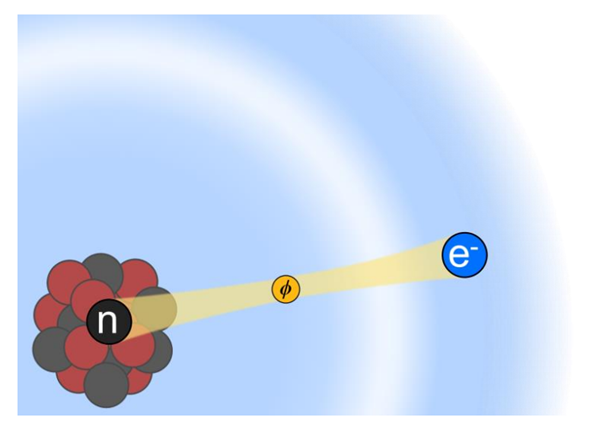
The idea behind how to use trapped ions (or atoms) to look for new force-carrying bosons was first put forward in this paper. The authors propose that very precise measurements of differences in energy levels of trapped ions could be be used to detect the existence of a new particle that carries a force between neutrons and electrons. Because isotopes have different numbers of neutrons (but are otherwise identical), if this new force between electrons and neutrons exists, the total force felt by the electrons in each isotope should be slightly different, and this should show up as a small shifts in the energy levels from isotope to isotope.
To measure these shifts in energy, what we do is measure the frequency of light emitted when our ions make a transition between two energy levels. We trap ions of the element Ytterbium (Yb), and we can selectively load a chosen isotope into our ion trap at a time. We measure transition frequencies in five different isotopes of Yb: 168Yb, 170Yb, 172Yb, 174Yb, 176Yb (the superscript is the atomic mass number, given by the sum of the number of neutrons and protons in the isotope. All of the isotopes have the same number of protons, 70, but the number of neutrons varies from 98 (for 168Yb ) to 106 (for 176Yb).

The trouble is that there are certain well-known nuclear physics effects that could also cause small shifts in transition energies between isotopes. One of these effects, for example, has to do with the fact that when we add neutrons to the nucleus of an atom or ion, the nucleus increases a little in volume, changing the way the positively charged protons are distributed. This in turn alters the pull the electrons feel from the nucleus a little, leading to small shifts in energy. Though well understood, these effects are difficult to calculate, so to differentiate them from the effects of any new force-carrying bosons, we use a clever trick devised by W. H. King in 1963 to analyse our data: the King Plot.
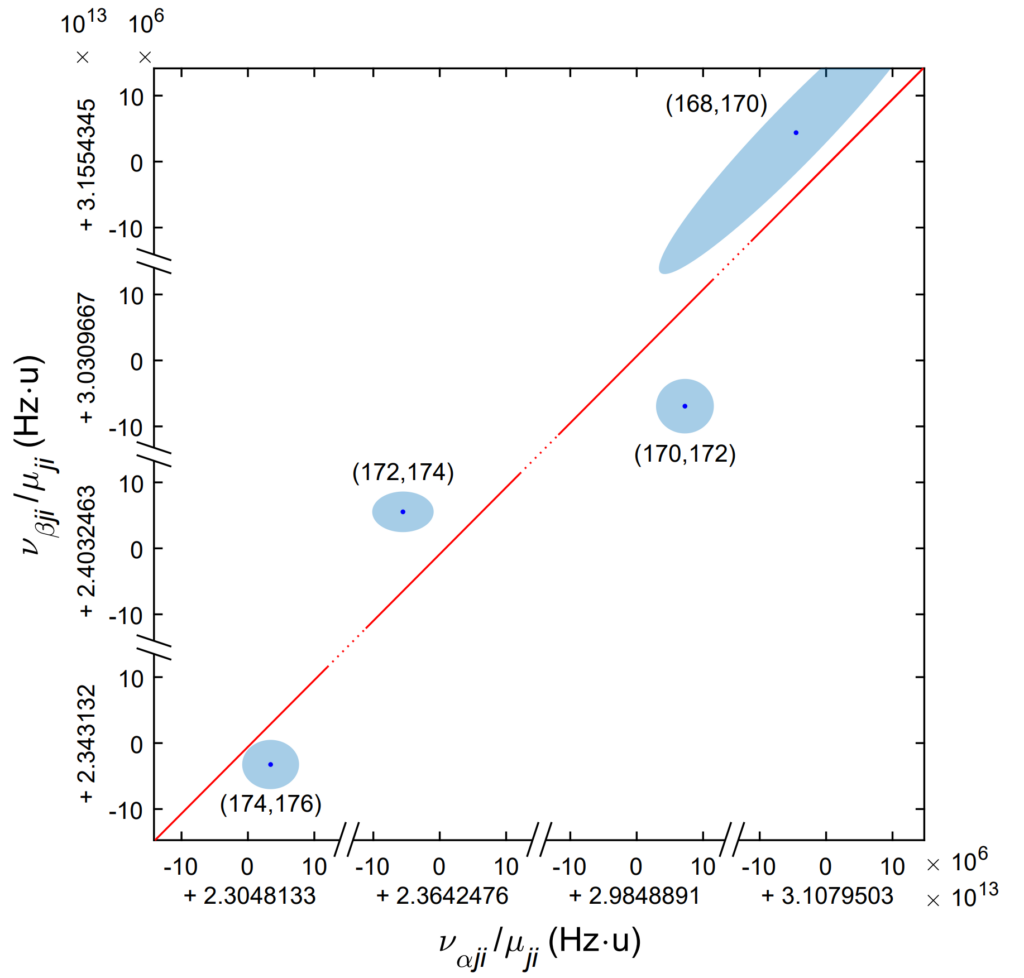
To make a King Plot, we choose two transitions (each between a pair of energy levels) – let’s call them α and β – and measure the frequencies of these same two transitions in all five isotopes. We make a list of our measured transition frequencies for each isotope, starting from the isotope with fewest neutrons to that with most neutrons. We then find the change in frequency for transitions α and β between successive pairs of isotopes in our list (we could have ordered the isotopes in a different way and chosen different pairings, but the nearest-neighbour pairing is what we used in our paper). Since we measure five isotopes, we end up with four measured frequency shifts for each transition (i.e. those four shifts are the changes in a given transition frequency from 168Yb to 170Yb, from 170Yb to 172Yb, from 172Yb to 174Yb and from 174Yb to 176Yb). Now we make our King Plot. We plot the four measured frequency shifts as points in this plot, with the x-axis coordinate of each point being the frequency shift for transition α divided by the mass difference between the isotope pair and the y-axis coordinate being the frequency shift for transition β, again divided by the mass difference between the isotope pair.
Now, here is the key thing about these King Plots: if the points we plot on it all lie on a straight line, then the frequency shifts we have measured are all due to expected nuclear physics effects. Things get more interesting, however, if we see a significant deviation in these points from a straight line. Such a deviation would have to be due either to higher-order nuclear effects (basically, more subtle nuclear physics) or to the presence of a new dark-matter force-carrying boson.
What we found really exciting is that, when we plotted our four points in the King Plot, we saw a non-linearity – i.e. the points deviated from a straight line! Our data analysis showed that we could be 99.7% certain it was not merely a statistical accident that our points do not lie on a straight line (that is equivalent to saying we observed non-linearity to 3σ confidence, as in the title of our paper).
Our measurement is not yet precise enough for us to tell if the non-linearity came from a new boson or from higher-order nuclear effects. However, we have now measured a third transition in all five isotopes and are currently analyzing this new data. The new transition should give us more sensitivity to the presence of a new boson. We are also planning a new set of measurements of all three transitions at higher precision, which should allow us to zero in on the source of the non-linearity – so, stay tuned! 🙂