Cartographic style in general refers to the overall style of a map. Beconyte1, for example, distinguishes between conventional, expressive, and artistic styles. This overall map style results from the visual appearance of a map’s individual objects—their symbology. This appearance, in turn, may be constructed using a specific configuration of graphic variables, for example, shape, colour, size, placement, orientation, and pattern.2 Therefore:
Cartographic style refers to both, the overall style of the map and the style of individual map objects. Illustrative cartographic styles refer to a specific type of cartographic styles. We define them as non-photorealistic, stylised, or artistic cartographic styles with a medium level of abstraction.
This definition is based on a term from the field of computer graphics, where illustrative rendering approaches aim at creating non-photorealistic, stylised, or artistic visualisations—illustrative visualisations—usually of 3D scenes. Their initial motivation was to create visualisations that look as if drawn by hand.3 Main applications are in the fields of computer-aided design, particularily in architecture, and scientific visualisation.
In general, the adjective illustrative describes the result of something that has been created through the action of illustrating. This verb to illustrate has two meanings when talking about visual appearance:4
- To ornament through drawings.
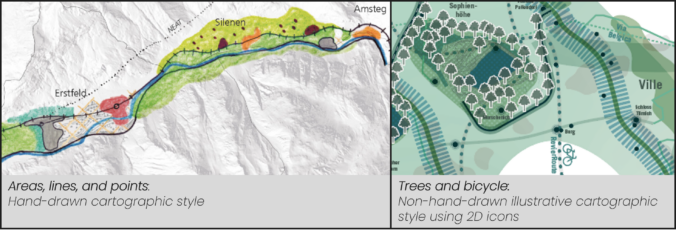
This results in something that is artistic and/or is or looks as if hand-drawn.
Example: Left map excerpt in the title image from the Zukunftsbild (vision map) for the Lower Reuss Valley, Switzerland.5 - To elucidate, explain through visual resemblance (but not photorealistic).
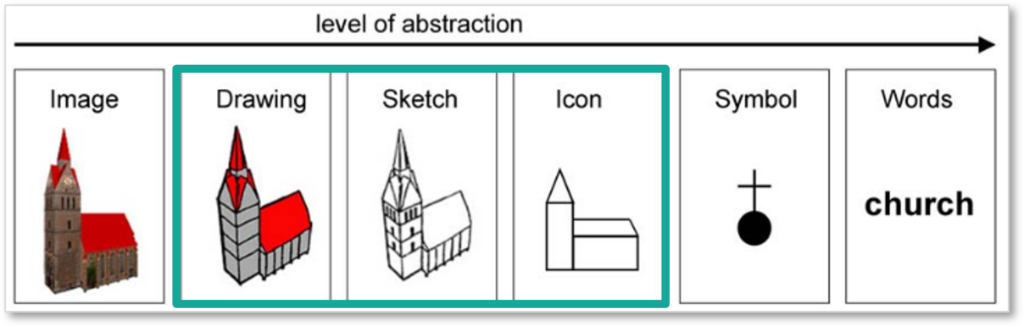
This results in visualisations with a medium level of abstraction (see image below).
Example: Right map excerpt in the title image from the map Resilienz- und Erholungslandschaften (resilience and recreation landscape) produced by the planning team ASTOC for the development of the Raumstrategie 2038+ for the Rhenish Mining Area, Germany.6
References
- 1.Beconyte G. Cartographic styles: criteria and parameters. In: ; 2011. https://icaci.org/files/documents/ICC_proceedings/ICC2011/Oral%20Presentations%20PDF/C1-Culture%20and%20map%20design/CO-208.pdf
- 2.Bertin J. Semiology of Graphics. University of Wisconsin Press; 1983.
- 3.Rautek P, Bruckner S, Gröller E, Viola I. Illustrative Visualization: New Technology or Useless Tautology? ACM SIGGRAPH Computer Graphics. 2008;42:1–8. doi:10.1145/1408626.1408633
- 4.illustrate, v. Oxford English Dictionary. https://www.oed.com/dictionary/illustrate_v
- 5.Achermann M, Hurter A, Meier A, et al. Agglomerationsprogramm Unteres Reusstal.; 2016. https://www.ur.ch/_docn/86161/AP_URT_Bericht.pdf.
- 6.Die Zukunft im Rheinischen Revier gestalten. Raumstrategie Rheinisches Revier 2038+. https://www.raum-strategie.de/
- 7.Elias B, Paelke V, Kuhnt S. Concepts for the Cartographic Visualization of Landmarks. In: 3rd Symposium on LBS & TeleCartography. ; 2005:149–155.
Leave a Reply