Last Monday, I successfully presented my research plan during my aptitude colloquium and have been officially admitted to ETH Zurich as a doctoral student. I had to present the motivation for my research in the context of the current research landscape, make an argument for my research questions and objectives and why the proposed approach is suitable to answer these questions. I shall try my best to replicate my reasoning with as little jargon as possible here. Most of the content below can also be found in the abstract of my project presentation during the International Cartographic Conference 2021.
Since the beginning of the 21st century, European spatial planning is experiencing an ongoing trend towards more integrated, adaptive, participatory, and informal processes to deal with complex or wicked problems.1,2 These are problems, where we will never be able to know their full extent nor what is the best way to solve them nor what a solution needs to look like. In fact, there are no correct or wrong solutions for wicked problems; only good or bad ones. An example for a wicked problem in spatial planning is the question of how to develop a city in a sustainable manner (see Figure 1 for an example). The development of a city is influenced by many factors, for example, political decisions, environmental conditions, and citizens’ lifestyles. Many of these factors are hard to predict or are even unknown. Moreover, they are influenced by cultural context and personal opinion. Therefore, there exists no ‘correct development’ for the city. But certain developments may be better than others. There also exists no standard procedure on how to find the best development strategy. Still, we need to come up with one.

One way to approach such problems is to generate lots of ideas and pit them against each other. By subjecting them to continuous evaluation and decision-making to weed out the inferior ones and further develop the superior ones, the most accepted one(s) will eventually prevail. This competition and evolution of ideas is called spatial design.4,5 It combines methods from science and design to gain more knowledge about the problem (e.g., about how the city works) and simultaneously generate new ideas for interventions (e.g., for steering the development into the desired direction).
Collaboration is an integral part of spatial design. There must be continuous exchange between spatial planners and stakeholders for the evolution of ideas to work in a democratic setting. To this end, spatial design must be made explicit.4 In other words, not only well-reasoned concepts and finished plans need to be communicated, but also partly-baked ideas—that is, assumptions, hypotheses, questions, and flashes of insight.
Maps are one of the favourite communicative media for spatial planners. And they are particularily suited to communicate partly-baked ideas because they create a fictional world. In this fictional world, the maps user can try out and test ideas, and hence gets animated to imagine and experiment.5,6 However, mapping partly-baked ideas during spatial design is a twofold challenge: An appropriate cartographic representation as well as suitable tools to create these representations during spatial design must be found.
In order to address the first challenge—finding appropriate cartographic representations for partly-baked ideas—we must first know what characterises partly-baked ideas. In cartographic terms, it is their uncertainty. Ideas by definition are uncertain—particularly those of low maturity—otherwise they would no longer be considered ‘just an idea’. However, uncertainty is a big term. There exist many types of uncertainties and many different ways of categorising them. This leads to the first research question of this doctoral project:
Research Question 1:
What types of uncertainties need to be considered when mapping partly-baked ideas during spatial design?
Once we have a clear picture of the type of uncertainties that characterise partly-baked ideas, we can then think about which cartographic representations would appropriately represent these characteristics. Researchers have studied how to visualise uncertainty in geospatial data for several decades.7–16 Yet, the impact of this research on the broader user community remains unsatisfactory,17 including on spatial planning. In particular, research on uncertainty visualisation during spatial design remains scarce or superficial. While the need for a cartographic representation of party-baked ideas that encourages discussion and promotes the emergence is undisputed, there exist no practical cartographic guidelines for it.4,18–20 The authors indicate that illustrative cartographic styles may be suitable, but without scientific evidence. Research findings from the general study of uncertainty visualisation, however, support this hypothesis.21–23 This leads to the second research question:
Research Question 2:
Are illustrative cartographic styles suitable for representing these types of uncertainties and thus partly-baked ideas in maps created during spatial design? Can recommendations for certain styles be made?
Knowing how to visualise partly-baked ideas in maps, we can finally address the second challenge: developing visualisation techniques for these illustrative styles that work in the spatial design process. This task may seem trivial at first. However, developing spatial data visualisation tools for spatial design is still a challenge.24
The main reason for this is that spatial planners use both, intuitive-creative and systematic-rational approaches. While the first are manually dominated—for example, using pen and paper—the latter are data-based and often use computers.19 As a result, planners usually switch back and forth between several visualisation tools throughout the design process. One family of tools that has received increased attention recently due to their flexiliby and power with regard to systematic-rational approaches are Geographic Information Systems (GIS).19 However, the remain unsuitable for intuitive-creative approaches since they still provide little support for visualising uncertainty.17,18 Bridging this gap would bring significant added value to the spatial design process, which leads to the third research question:
Research Question 3:
With which visualisation techniques can these illustrative cartographic styles be created in GIS?
Research Approach
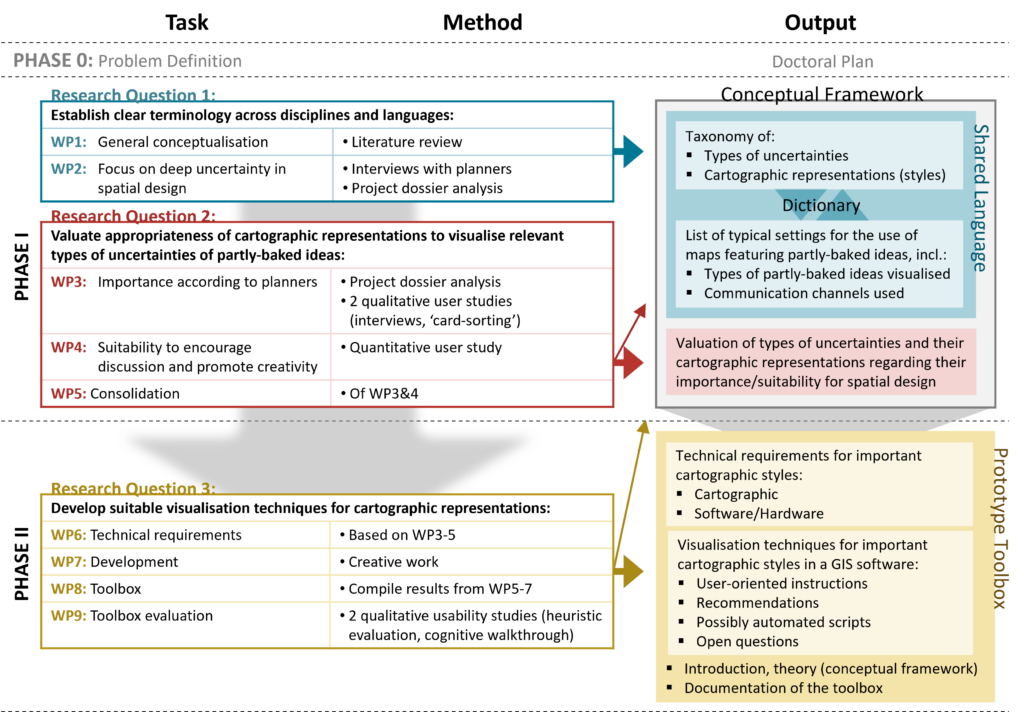
In order to answer these research questions, we will follow an iterative approach based on the Uncertainty Visualisation Development Strategy (UVDS) by Lapinski25 and the research design used by Judge and Harrie20; see also Figure 2.
First, we will review existing literature, analyse map dossiers of planning projects, and talk to spatial planners to answer the first research question. The goal is to establish a clear terminology that can be understood across disciplines and languages. The need for such a shared language quickly becomes apparent in discussions between planners and cartographers, and when comparing the literature of the two disciplines. Afterwards, we will further analyse the project dossiers—this time regarding the cartographic representations employed to visualise the uncertanties of partly-baked ideas. Together with user studies, this will provide answers to the second research question. These answers of the first two research questions (what types of uncertainty to consider and how to visualise them on maps) will serve as a conceptual framework for the visualisation of partly-baked ideas in spatial design.
Based on this conceptual framework, we will then develop suitable visualisation techniques for selected cartographic representations, that is, supposedly illustrative cartographic styles. We will aim at techniques that keep the connection to the underlaying data and are as automated as possible in order to answer the thrid research question. These techniques will be compiled in a prototype toolbox targeted at spatial planners. It’s purpose is to provide them with user-friendly tools (as in programs) and cartographic knowledge on how to create high-quality maps that show partly-baked ideas in such a way that they foster imagination and creativity.
References
- 1.Nadin V, Stead D, Dąbrowski M, Fernandez-Maldonado AM. Integrated, adaptive and participatory spatial planning: trends across Europe. Regional Studies. 2021;55:791–803. doi:10.1080/00343404.2020.1817363
- 2.Dühr S. The Visual Language of Spatial Planning: Exploring Cartographic Representations for Spatial Planning in Europe. Routledge; 2007. https://www.routledge.com/The-Visual-Language-of-Spatial-Planning-Exploring-Cartographic-Representations/Duhr/p/book/9780415395823
- 3.AS&P. Städtebaulicher Masterplan Innenstadt Köln.
- 4.Nollert M. Raumplanerisches Entwerfen. ETH Zurich; 2013. https://www.research-collection.ethz.ch/handle/20.500.11850/71036
- 5.Prominski M, von Seggern H, eds. Design Research for Urban Landscapes: Theories and Methods. Routledge; 2019.
- 6.Ljungberg C. Creative Dynamics: Diagrammatic Strategies in Narrative. John Benjamins Pub. Co; 2012.
- 7.Bertin J. Semiology of Graphics. University of Wisconsin Press; 1983.
- 8.Wittenbrink C, Pang A, Lodha S. Glyphs for Visualizing Uncertainty in Vector Fields. Visualization and Computer Graphics, IEEE Transactions on. 1996;2:266–279. doi:10.1109/2945.537309
- 9.Drecki I. Visualisation of Uncertainty in Geographical data. In: Spatial Data Quality. CRC Press; 2002:144–163. https://doi.org/10.1201/b12657-19
- 10.Drecki I, Maciejewska I. Dealing with uncertainty in large-scale spatial databases. In: Proceedings of the 22nd International Cartographic Conference. ; 2005. https://icaci.org/files/documents/ICC_proceedings/ICC2005/htm/pdf/oral/TEMA7/Session%204/IGOR%20DRECKI.pdf
- 11.MacEachren AM, Robinson A, Hopper S, et al. Visualizing Geospatial Information Uncertainty: What We Know and What We Need to Know. Cartography and Geographic Information Science. 2005;32:139–160. doi:10.1559/1523040054738936
- 12.Brodlie K, Osorio RA, Lopes A. A Review of Uncertainty in Data Visualization. In: Expanding the Frontiers of Visual Analytics and Visualization. Springer; 2012:81–109. doi:10.1007/978-1-4471-2804-5_6
- 13.Senaratne H, Gerharz L, Pebesma E, Schwering A. Usability of Spatio-Temporal Uncertainty Visualisation Methods. In: Gensel J, Josselin D, Vandenbroucke D, eds. Bridging the Geographic Information Sciences: International AGILE’2012 Conference, Avignon (France), April, 24-27, 2012. Springer; 2012:3–23. doi:10.1007/978-3-642-29063-3_1
- 14.Senaratne H, Mobasheri A, Ali AL, Capineri C, Haklay M (Muki). A review of volunteered geographic information quality assessment methods. International Journal of Geographical Information Science. 2017;31:139–167. doi:10.1080/13658816.2016.1189556
- 15.Kinkeldey C, Senaratne H. Representing Uncertainty. Geographic Information Science & Technology Body of Knowledge. 2018;2018. doi:10.22224/gistbok/2018.2.3
- 16.MacEachren AM. Visualizing Uncertain Information. Cartographic Perspectives. Published online June 1992:10–19. doi:10.14714/CP13.1000
- 17.Goodchild MF. How well do we really know the world? Uncertainty in GIScience. Journal of Spatial Information Science. Published online June 2020:97–102. doi:10.5311/JOSIS.2020.20.664
- 18.Stéphane Roche. Towards a “Leonardo da Vinci approach” of GIS for Spatial Design. In: ; 2009. https://docplayer.net/10125088-Towards-a-leonardo-da-vinci-approach-of-gis-for-spatial-design.html
- 19.Berchtold M. Sich Ein Bild Machen – Die Rolle von GIS Als Werkzeug Bei Aufgaben in Räumen Mit Unklarer Problemlage. 2016. doi:10.5445/IR/1000060125
- 20.Judge S, Harrie L. Visualizing a Possible Future: Map Guidelines for a 3D Detailed Development Plan. Journal of Geovisualization and Spatial Analysis. 2020;4:7. doi:10.1007/s41651-020-00049-4
- 21.Wray K. Using the Creative Design Process to Develop Illustrative Rendering Techniques to Represent Information Quality. Journal of Young Investigators. Published online July 2007. https://www.jyi.org/2007-july/2017/11/10/using-the-creative-design-process-to-develop-illustrative-rendering-techniques-to-represent-information-quality
- 22.Isenberg T. Evaluating and Validating Non-photorealistic and Illustrative Rendering. In: Rosin P, Collomosse J, eds. Image and Video-Based Artistic Stylisation. Vol 42. Springer; 2013:311–331. doi:10.1007/978-1-4471-4519-6_15
- 23.MacEachren AM, Roth RE, O’Brien J, Li B, Swingley D, Gahegan M. Visual Semiotics & Uncertainty Visualization: An Empirical Study. IEEE Transactions on Visualization and Computer Graphics. 2012;18:2496–2505. doi:10.1109/TVCG.2012.279
- 24.Billger M, Thuvander L, Wästberg BS. In search of visualization challenges: The development and implementation of visualization tools for supporting dialogue in urban planning processes. Environment and Planning B: Urban Analytics and City Science. 2017;44:1012–1035. doi:10.1177/0265813516657341
- 25.Lapinski ALS. A Strategy for Uncertainty Visualization Design. Defence Research and Development Canada; 2009. https://apps.dtic.mil/sti/pdfs/ADA523694.pdf
Leave a Reply